


How I Mechanically Confirm Daily Bias
Model
How I Mechanically Confirm Daily Bias
Daily profiles confirm bias by tracking how the daily candle develops across Asia, London, and New York sessions. Using three 7-hour candles and a simple “if this, then that” process, we align with high-probability continuation or reversal setups. This removes prediction and brings consistent follow through by focusing execution in the New York session.
The Mistake Most Traders Make
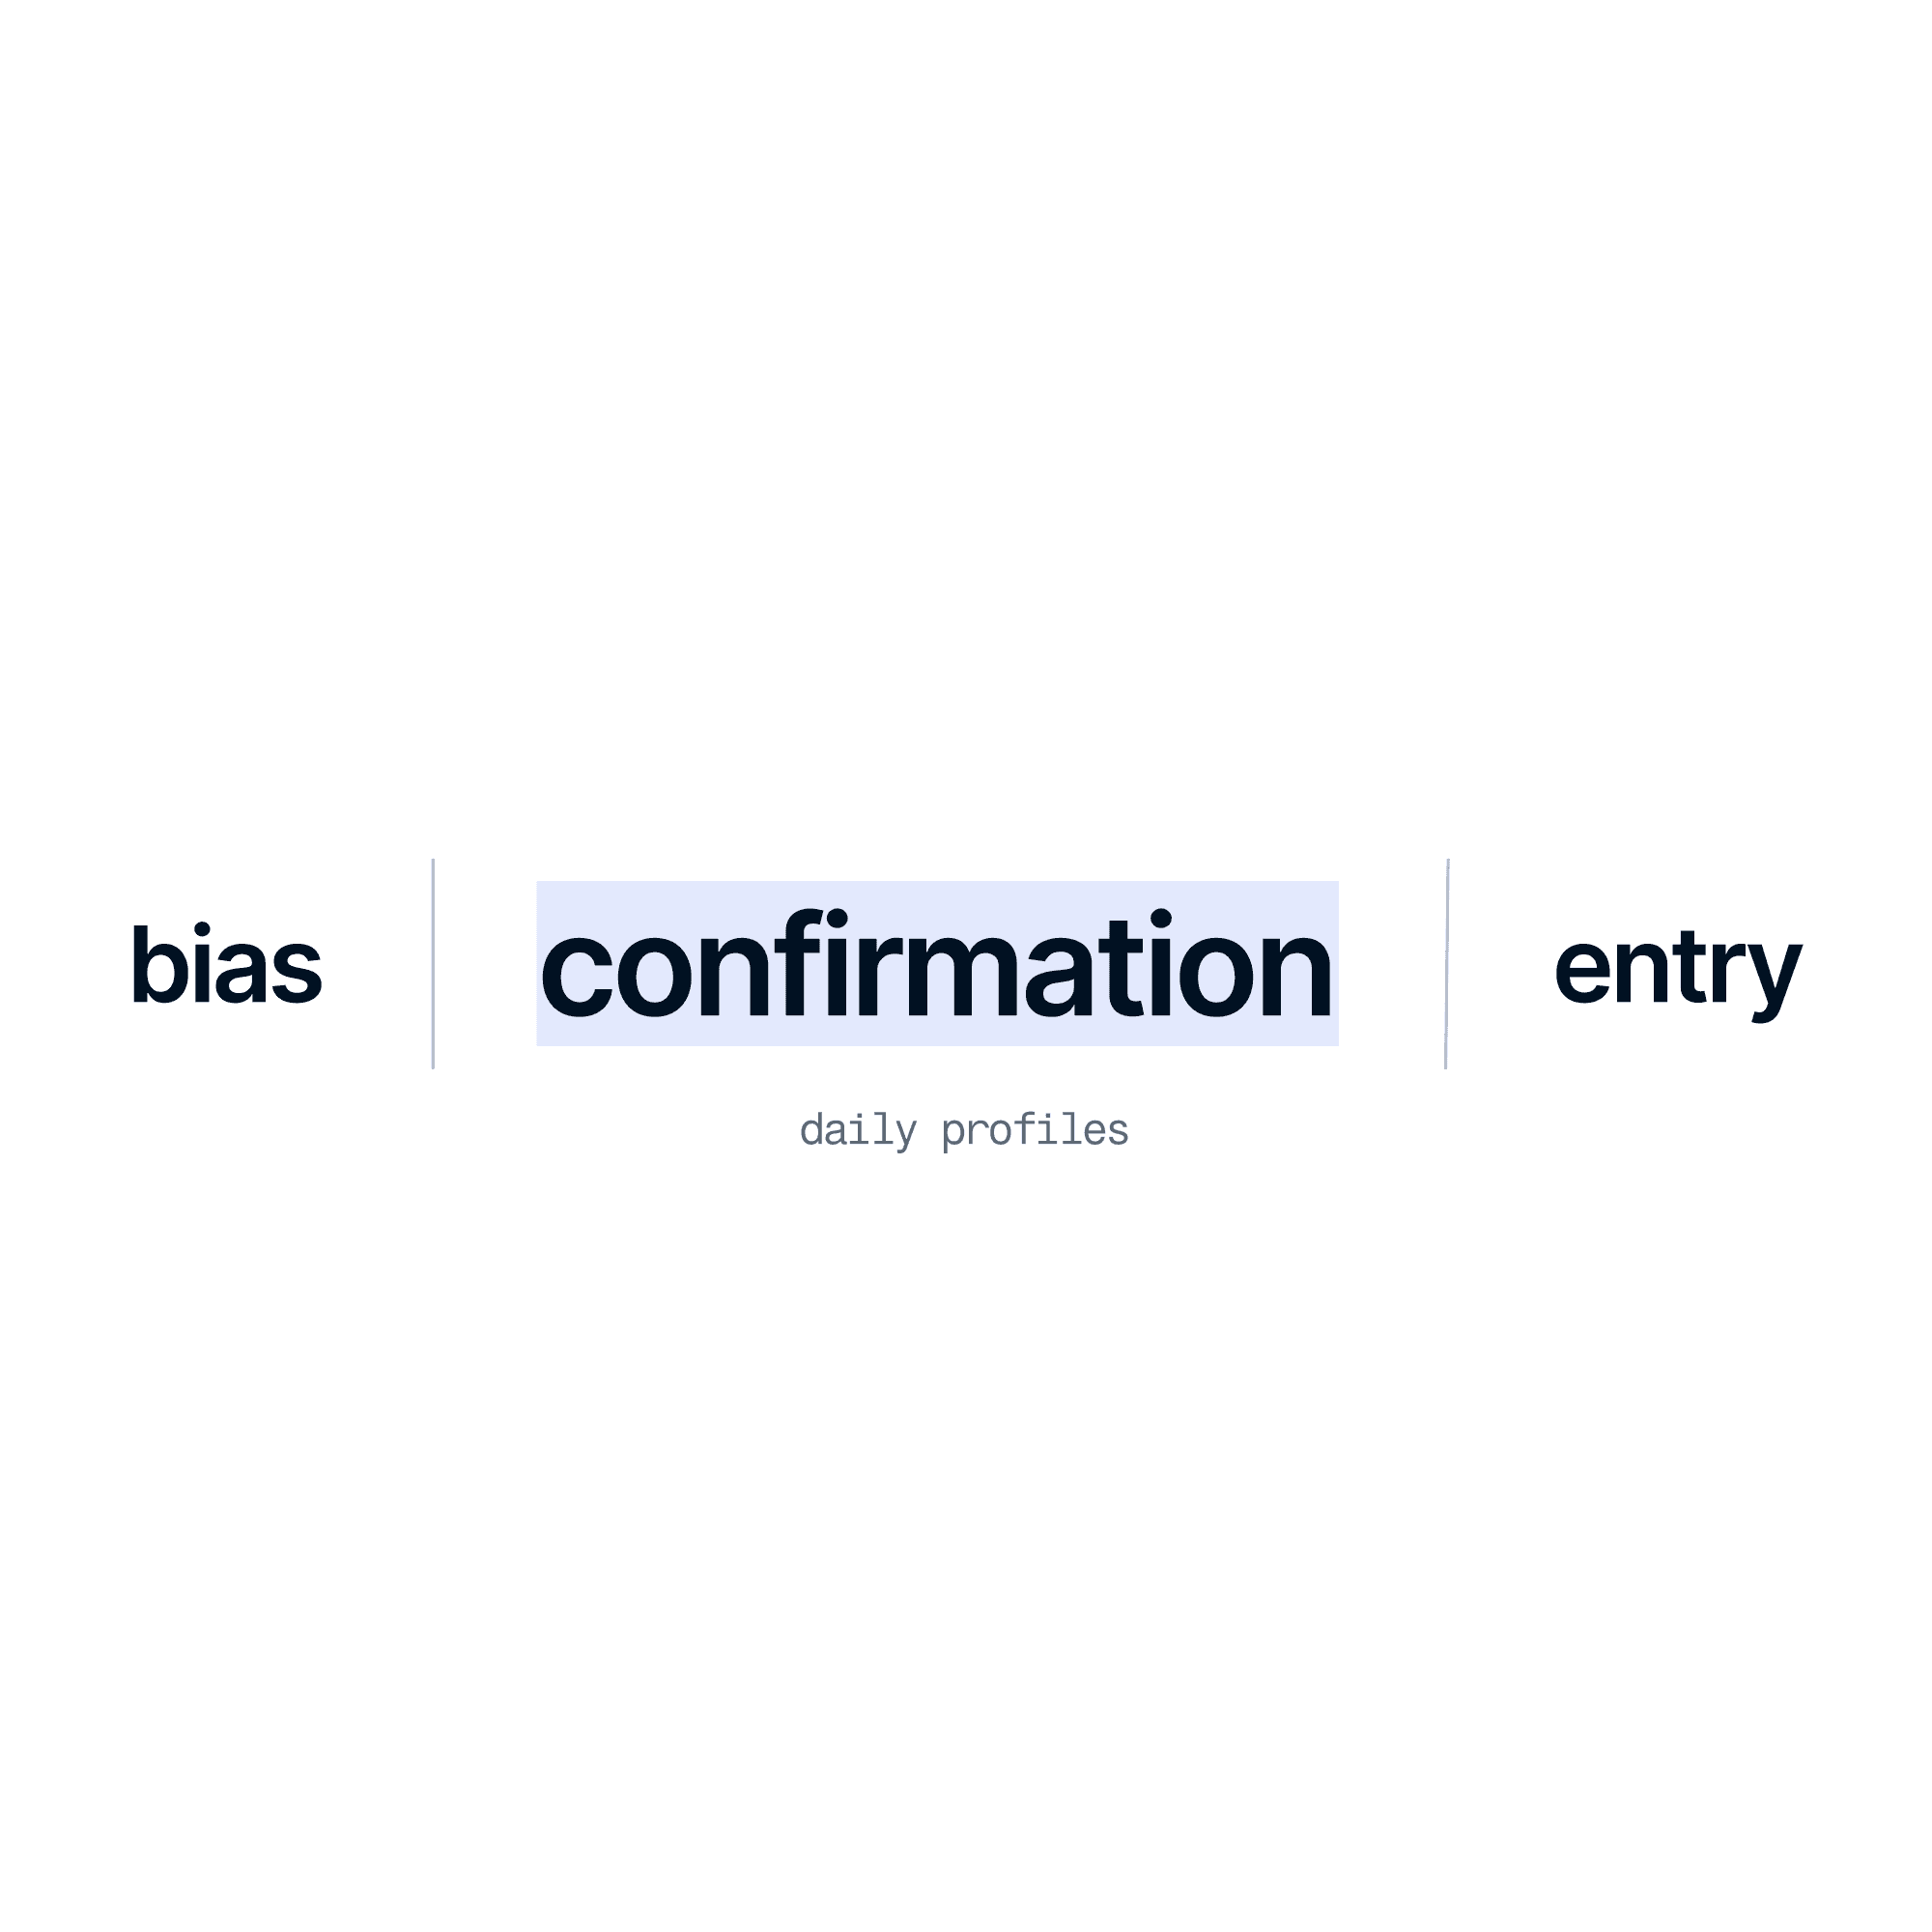
Inside my system, every trade follows three layers before a position is opened: bias, confirmation, and entry. Daily profiles sit in the middle as the confirmation step.
The mistake many traders make is forming a bias off the higher timeframe and immediately looking for an entry. When you skip confirmation, two problems follow. The first is timing. Without a defined development to wait on, you have no framework for when the bias should play out or when it is no longer valid. The second is accuracy. Your bias will not be correct every time. Days where the bias is wrong but a daily profile never confirms means you never execute. You avoid the loss entirely without needing to predict anything.
Daily profiles move you away from being a predictor of the market. They give you a structured process to follow so that execution only happens when there is reason to act, not just because a higher timeframe idea exists.
The Logic of the Daily Market Sessions
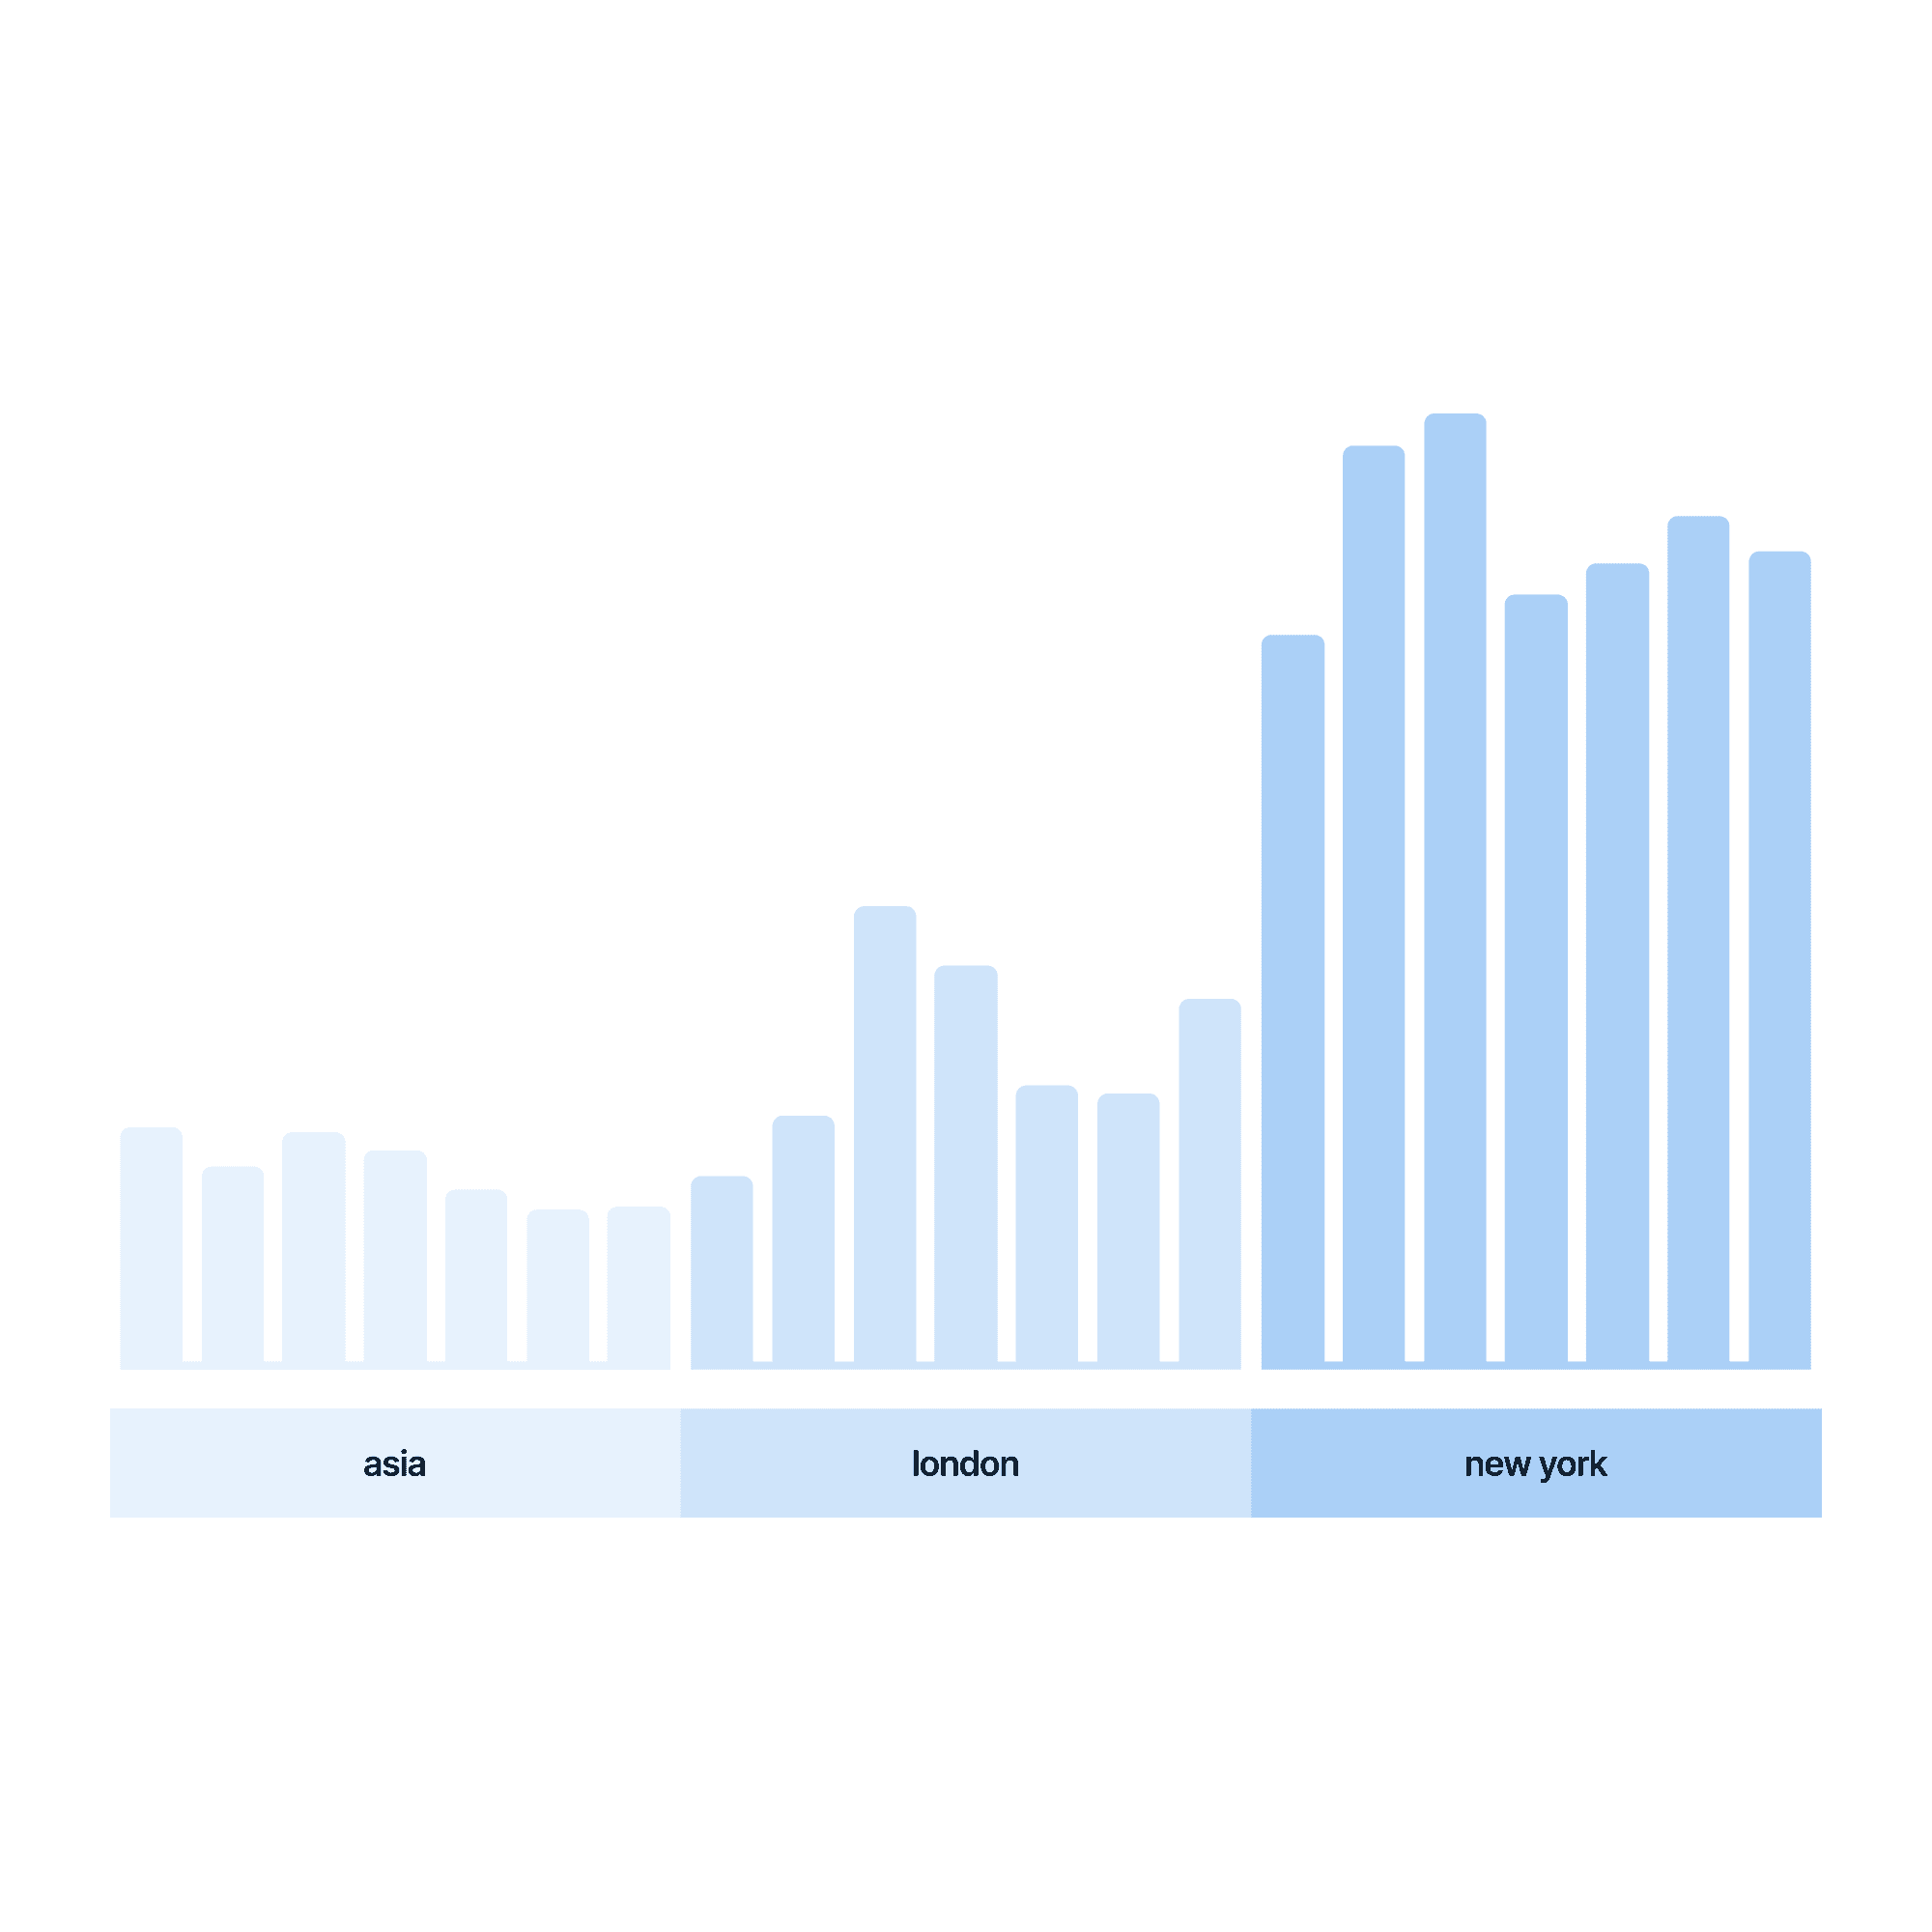
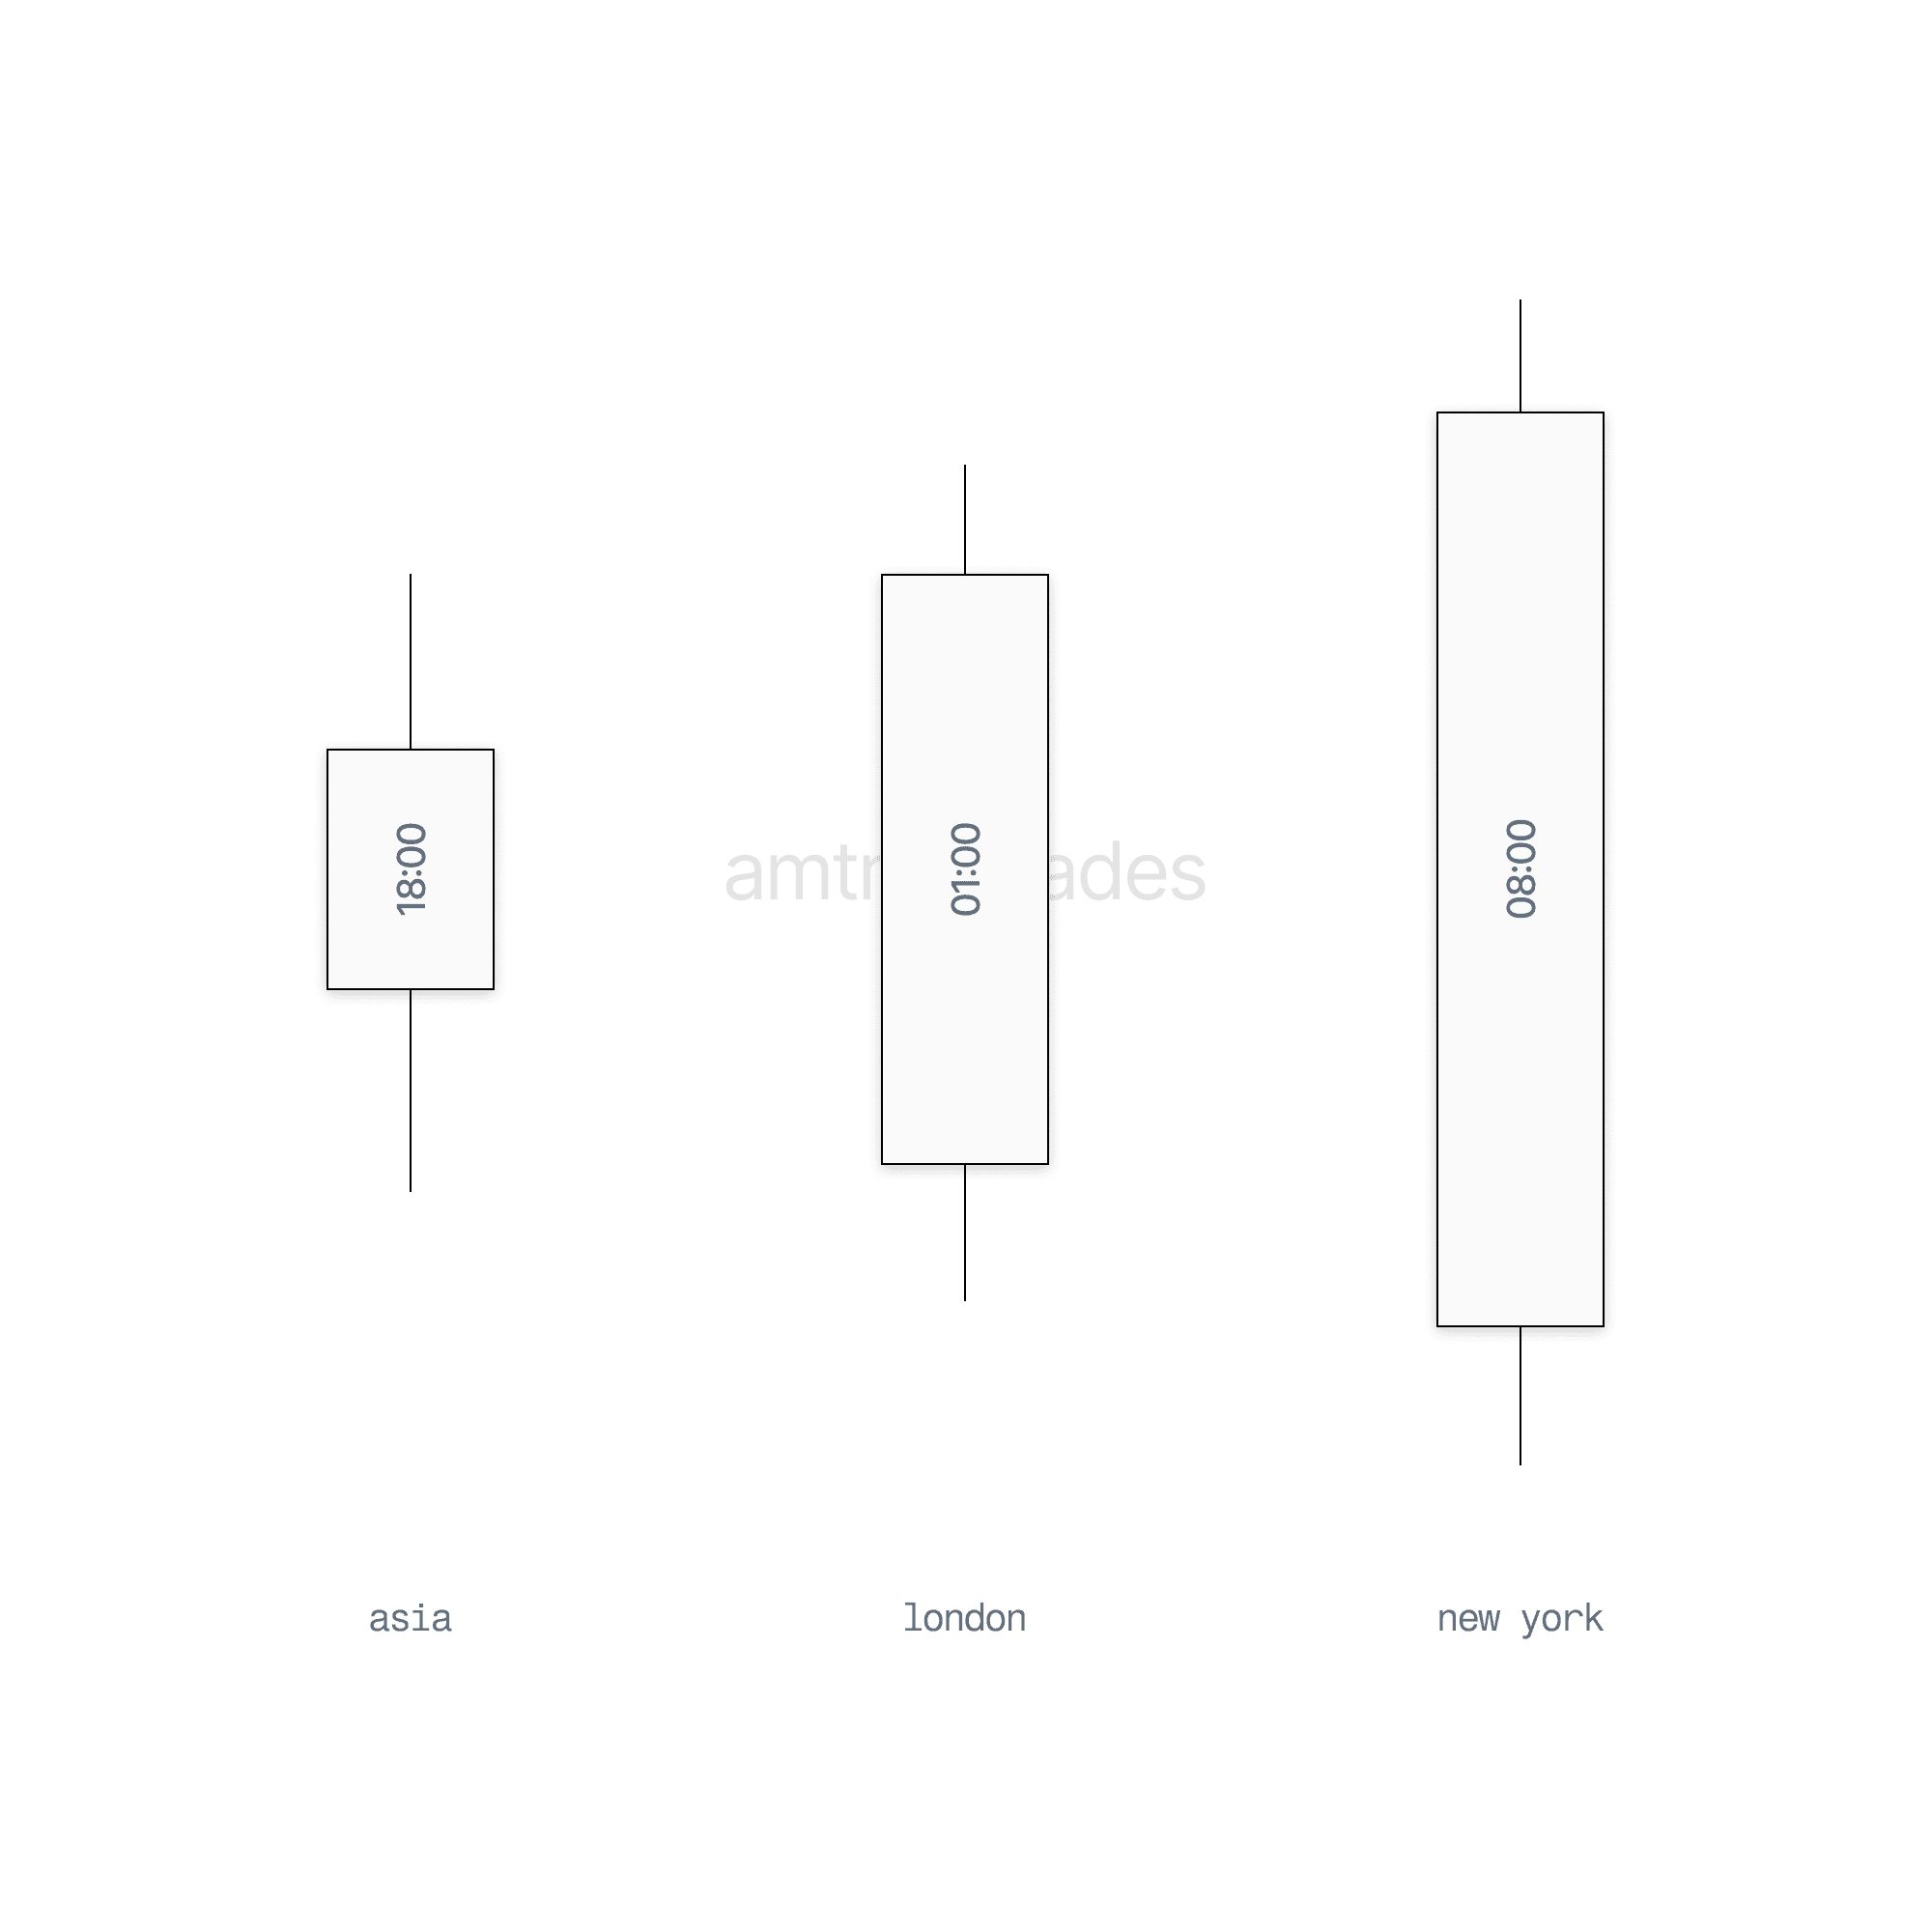
To understand daily profiles, you first need to understand the sessions that make up each daily candle. The daily candle is divided into three sessions. Asia runs from 18:00 to 01:00. London runs from 01:00 to 08:00. New York runs from 08:00 to close. All times in Eastern Standard (EST). Each session is a 7-hour window, and using a 7-hour timeframe on your chart gives you three candles that represent each session individually.
This timeframe is used because it captures session logic. The market recognizes session opens and key news times. Using the 7-hour chart gives relevance to the candles being analyzed.
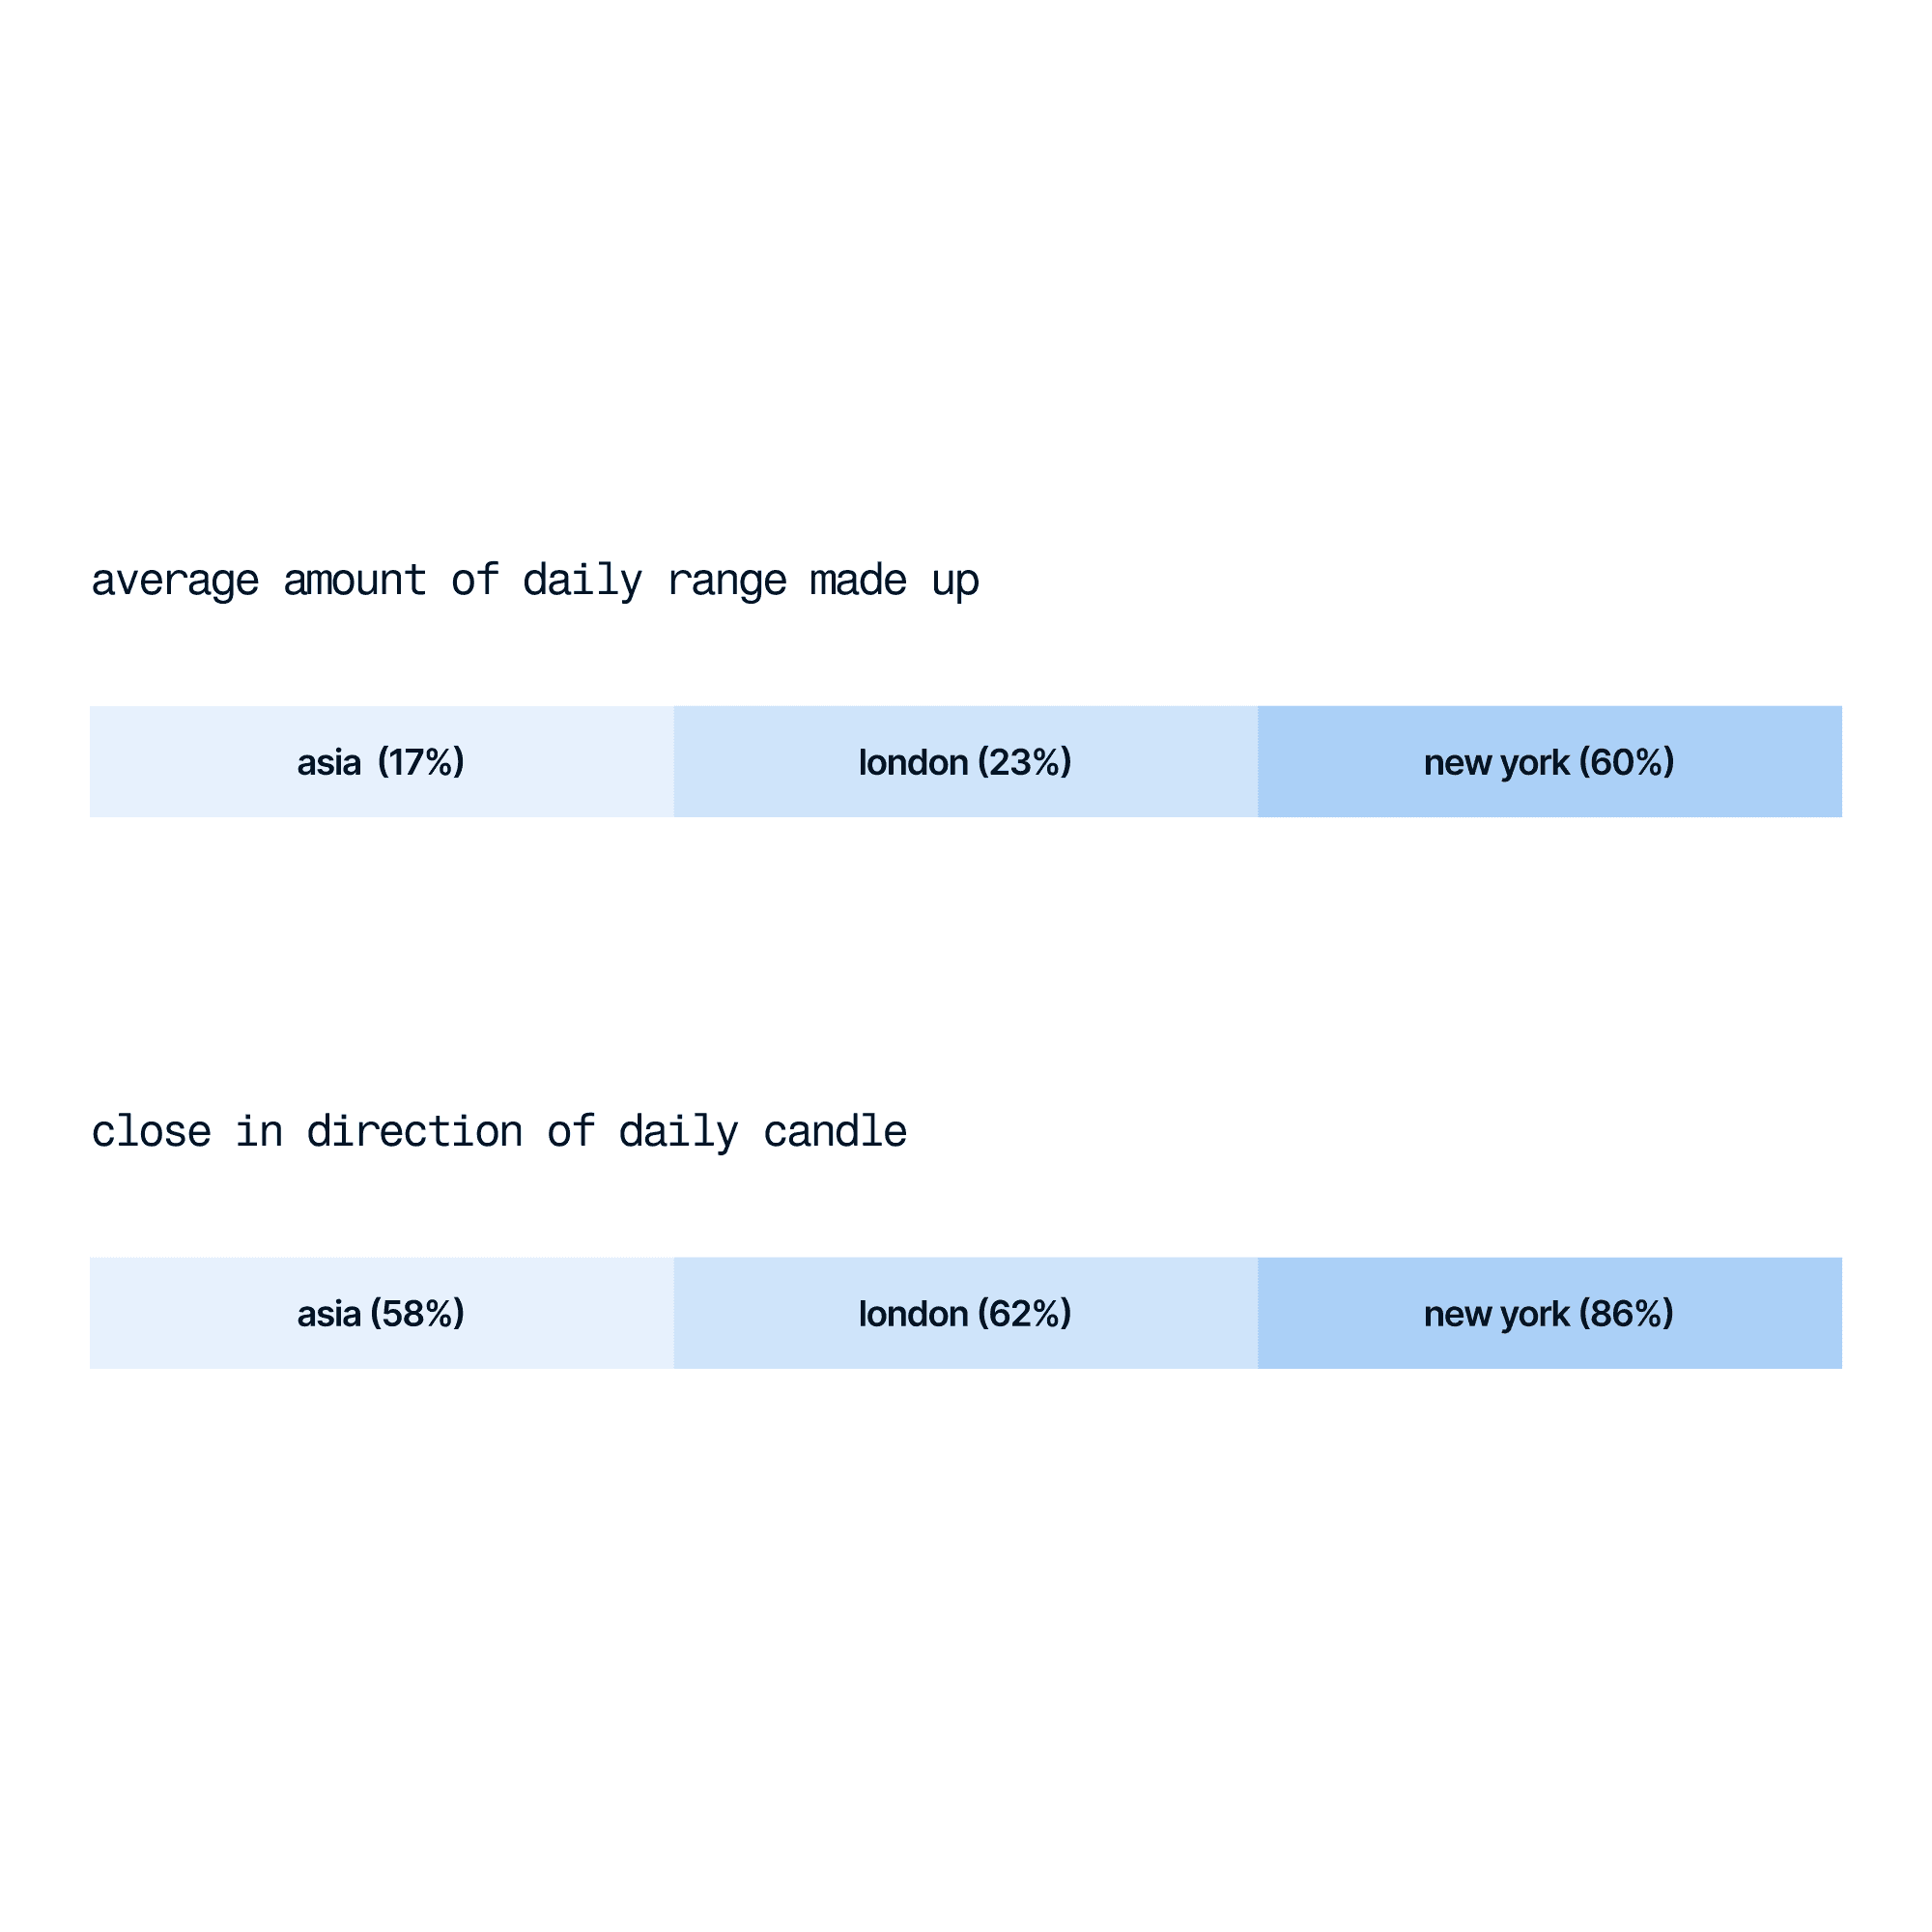
The data behind these sessions makes the logic clear. The Asia session accounts for roughly 17% of the average daily range. London accounts for 23%. New York accounts for 60%. When it comes to closing in the direction of the daily candle, Asia does so 58% of the time, London 62%, and New York 86%. This is why inside of the daily profile we use the 18:00 candle as the opening context, the 01:00 candle development to determine the profile, and execute within the 08:00 candle.
New York makes the majority of the daily range and is the most likely session to close in the direction of the daily candle by a significant margin. That is where execution focus belongs.
The Three Daily Profiles to Seek
There are three profiles that confirm a bias is developing in a way that is likely to follow through. Each one tells you something specific about where the intraday reversal is forming and what the New York session should do. Once a bias is established, demand clear alignment of one of the three profiles. Ignore anything else.
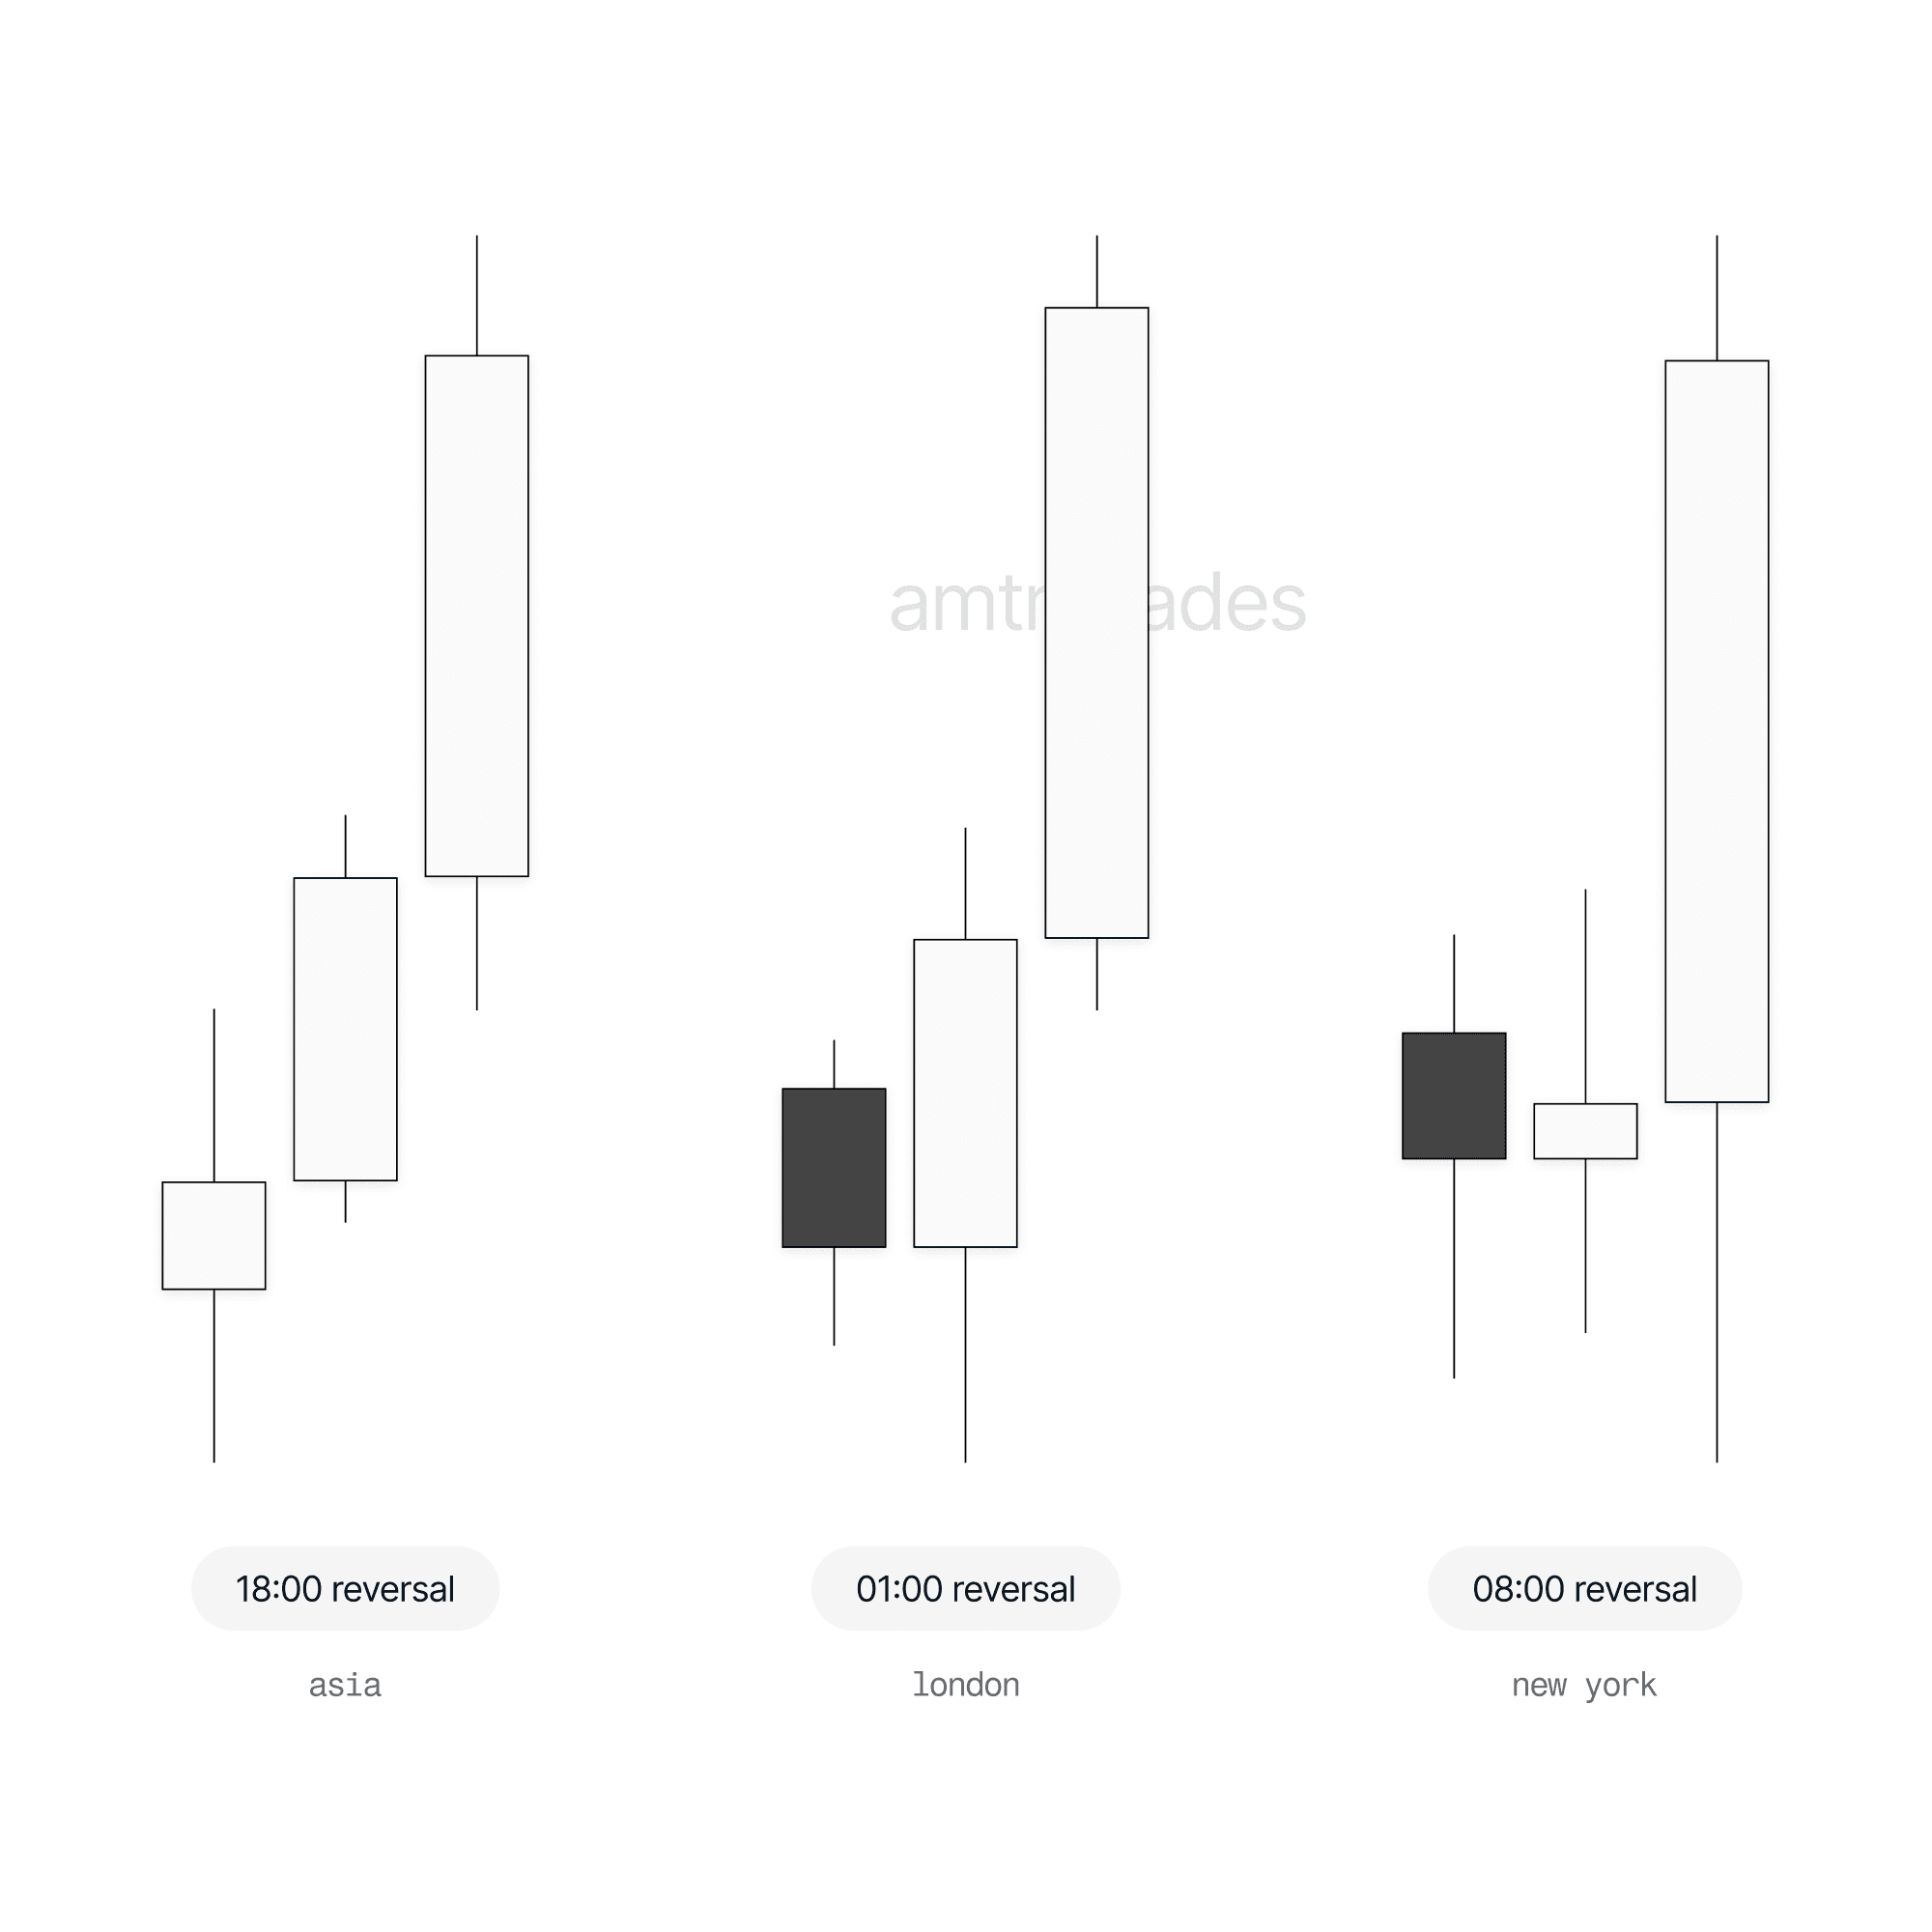
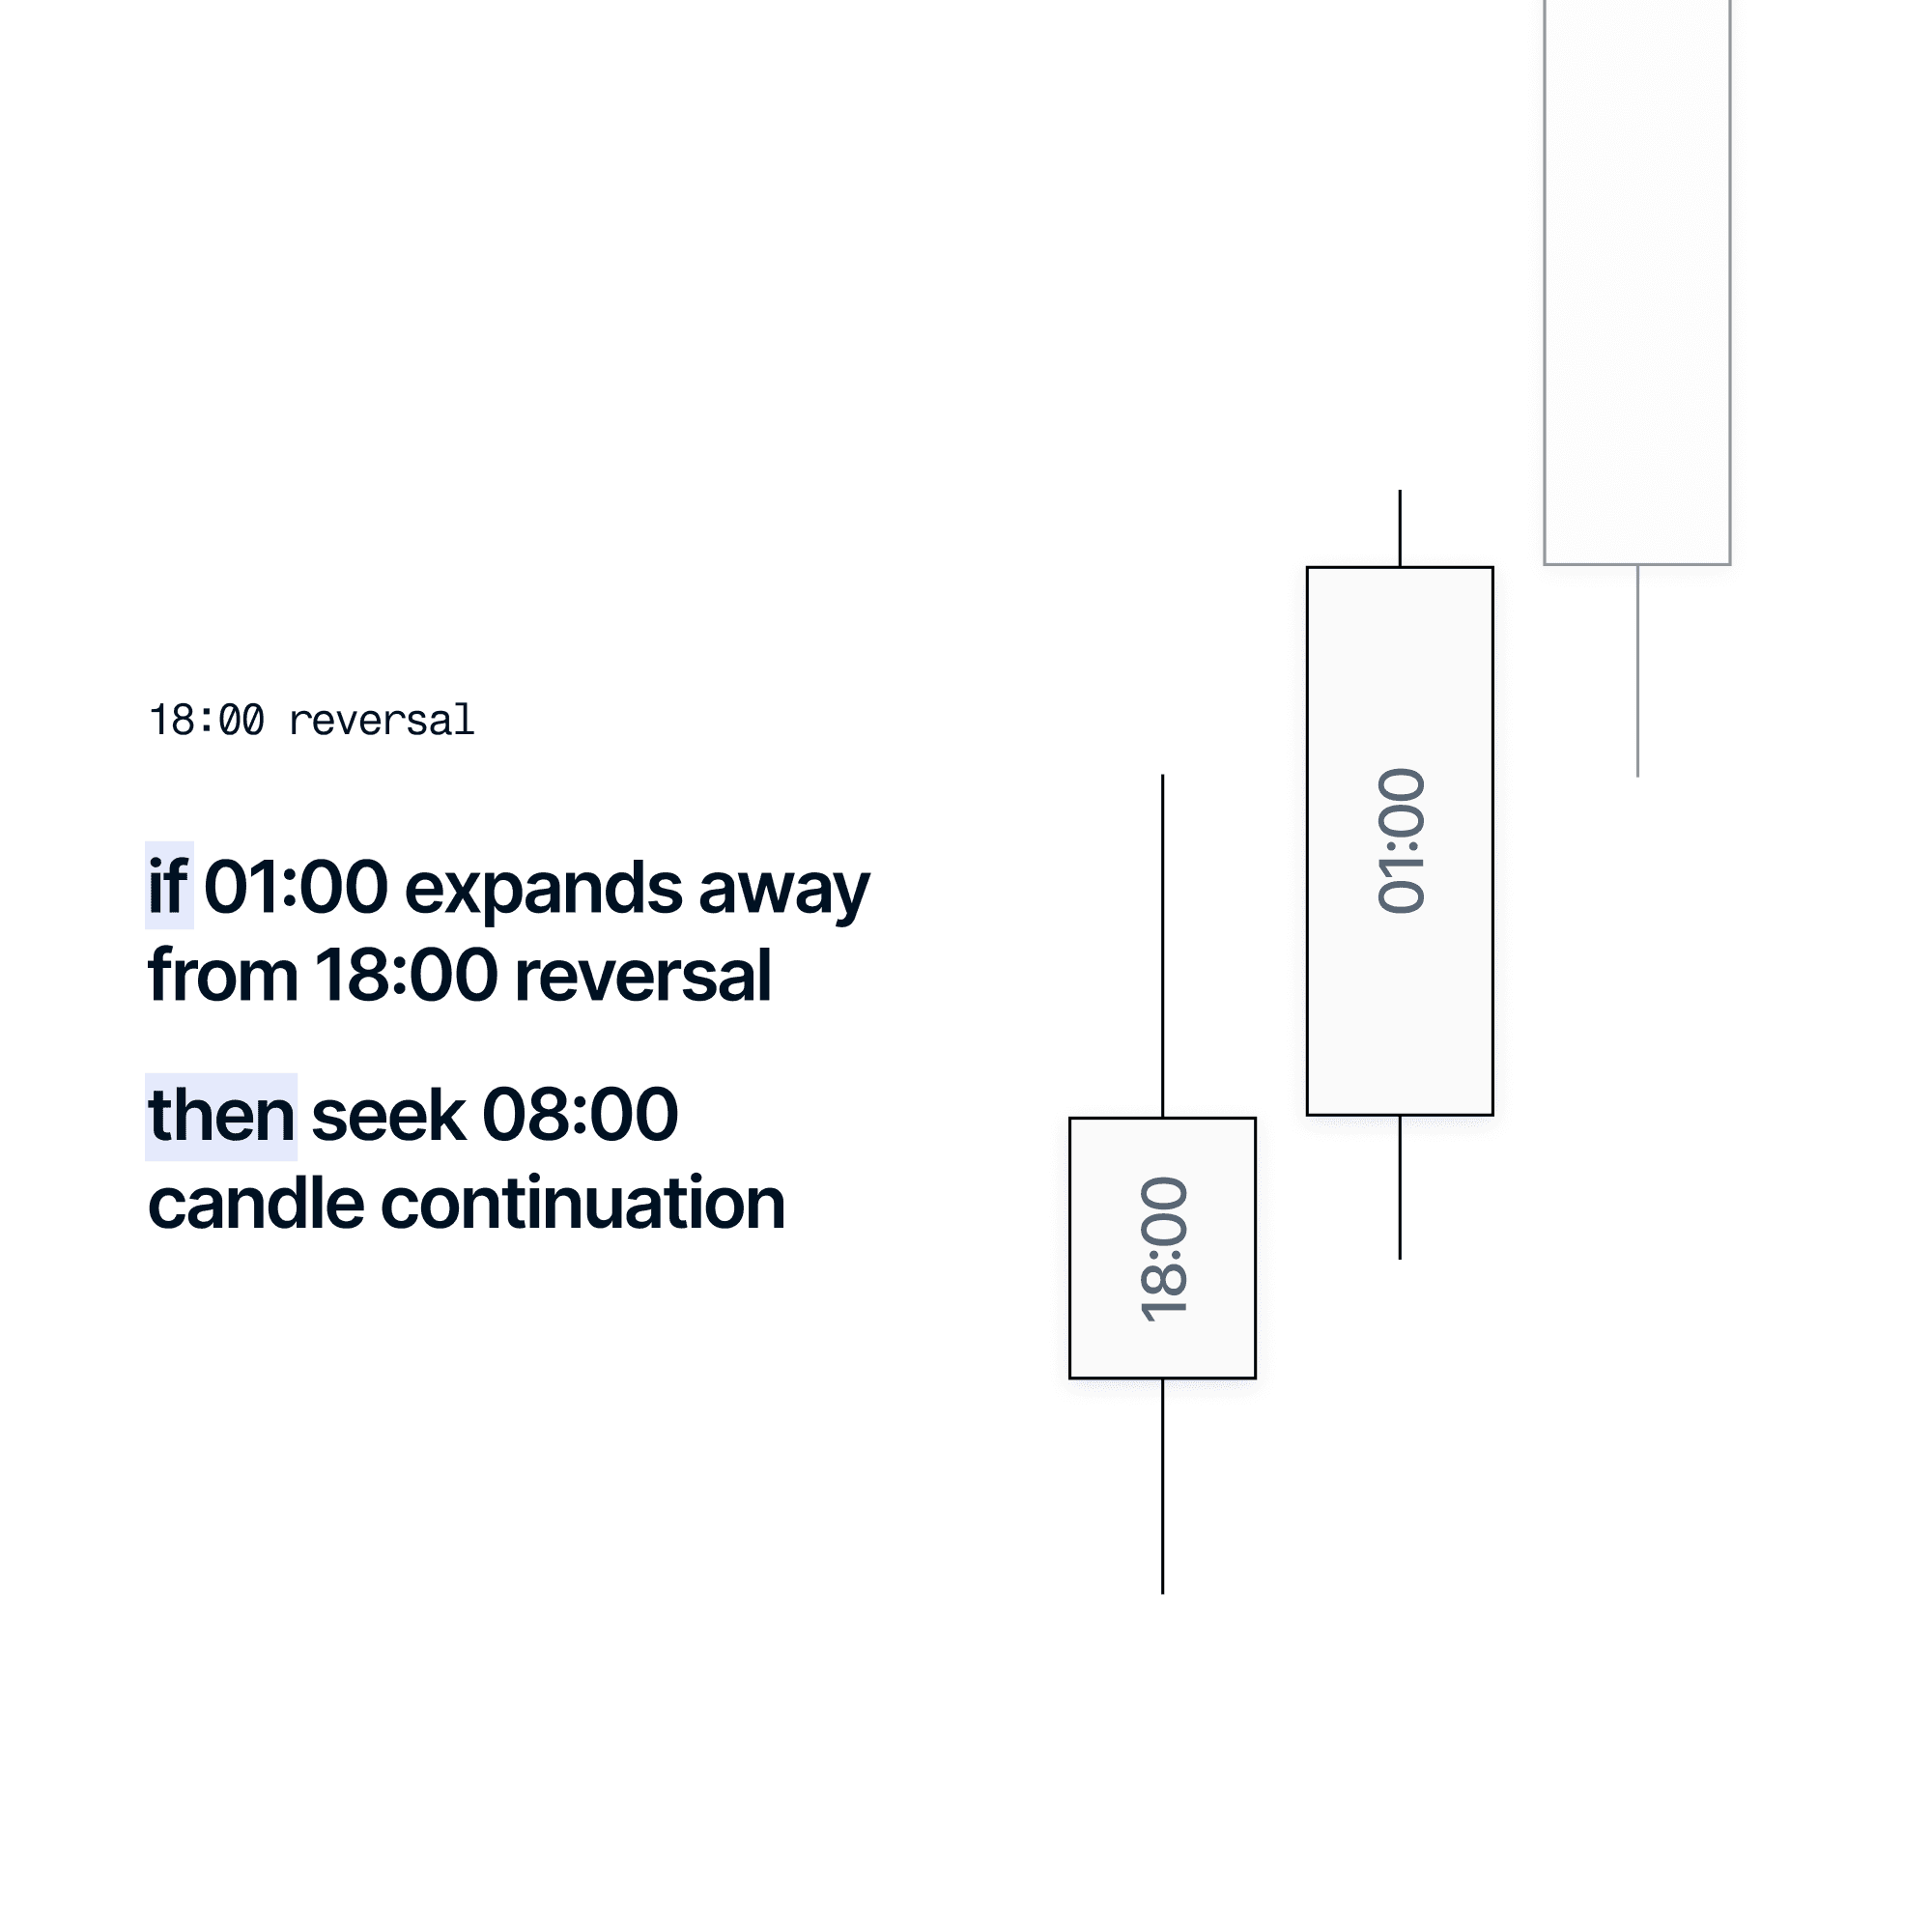
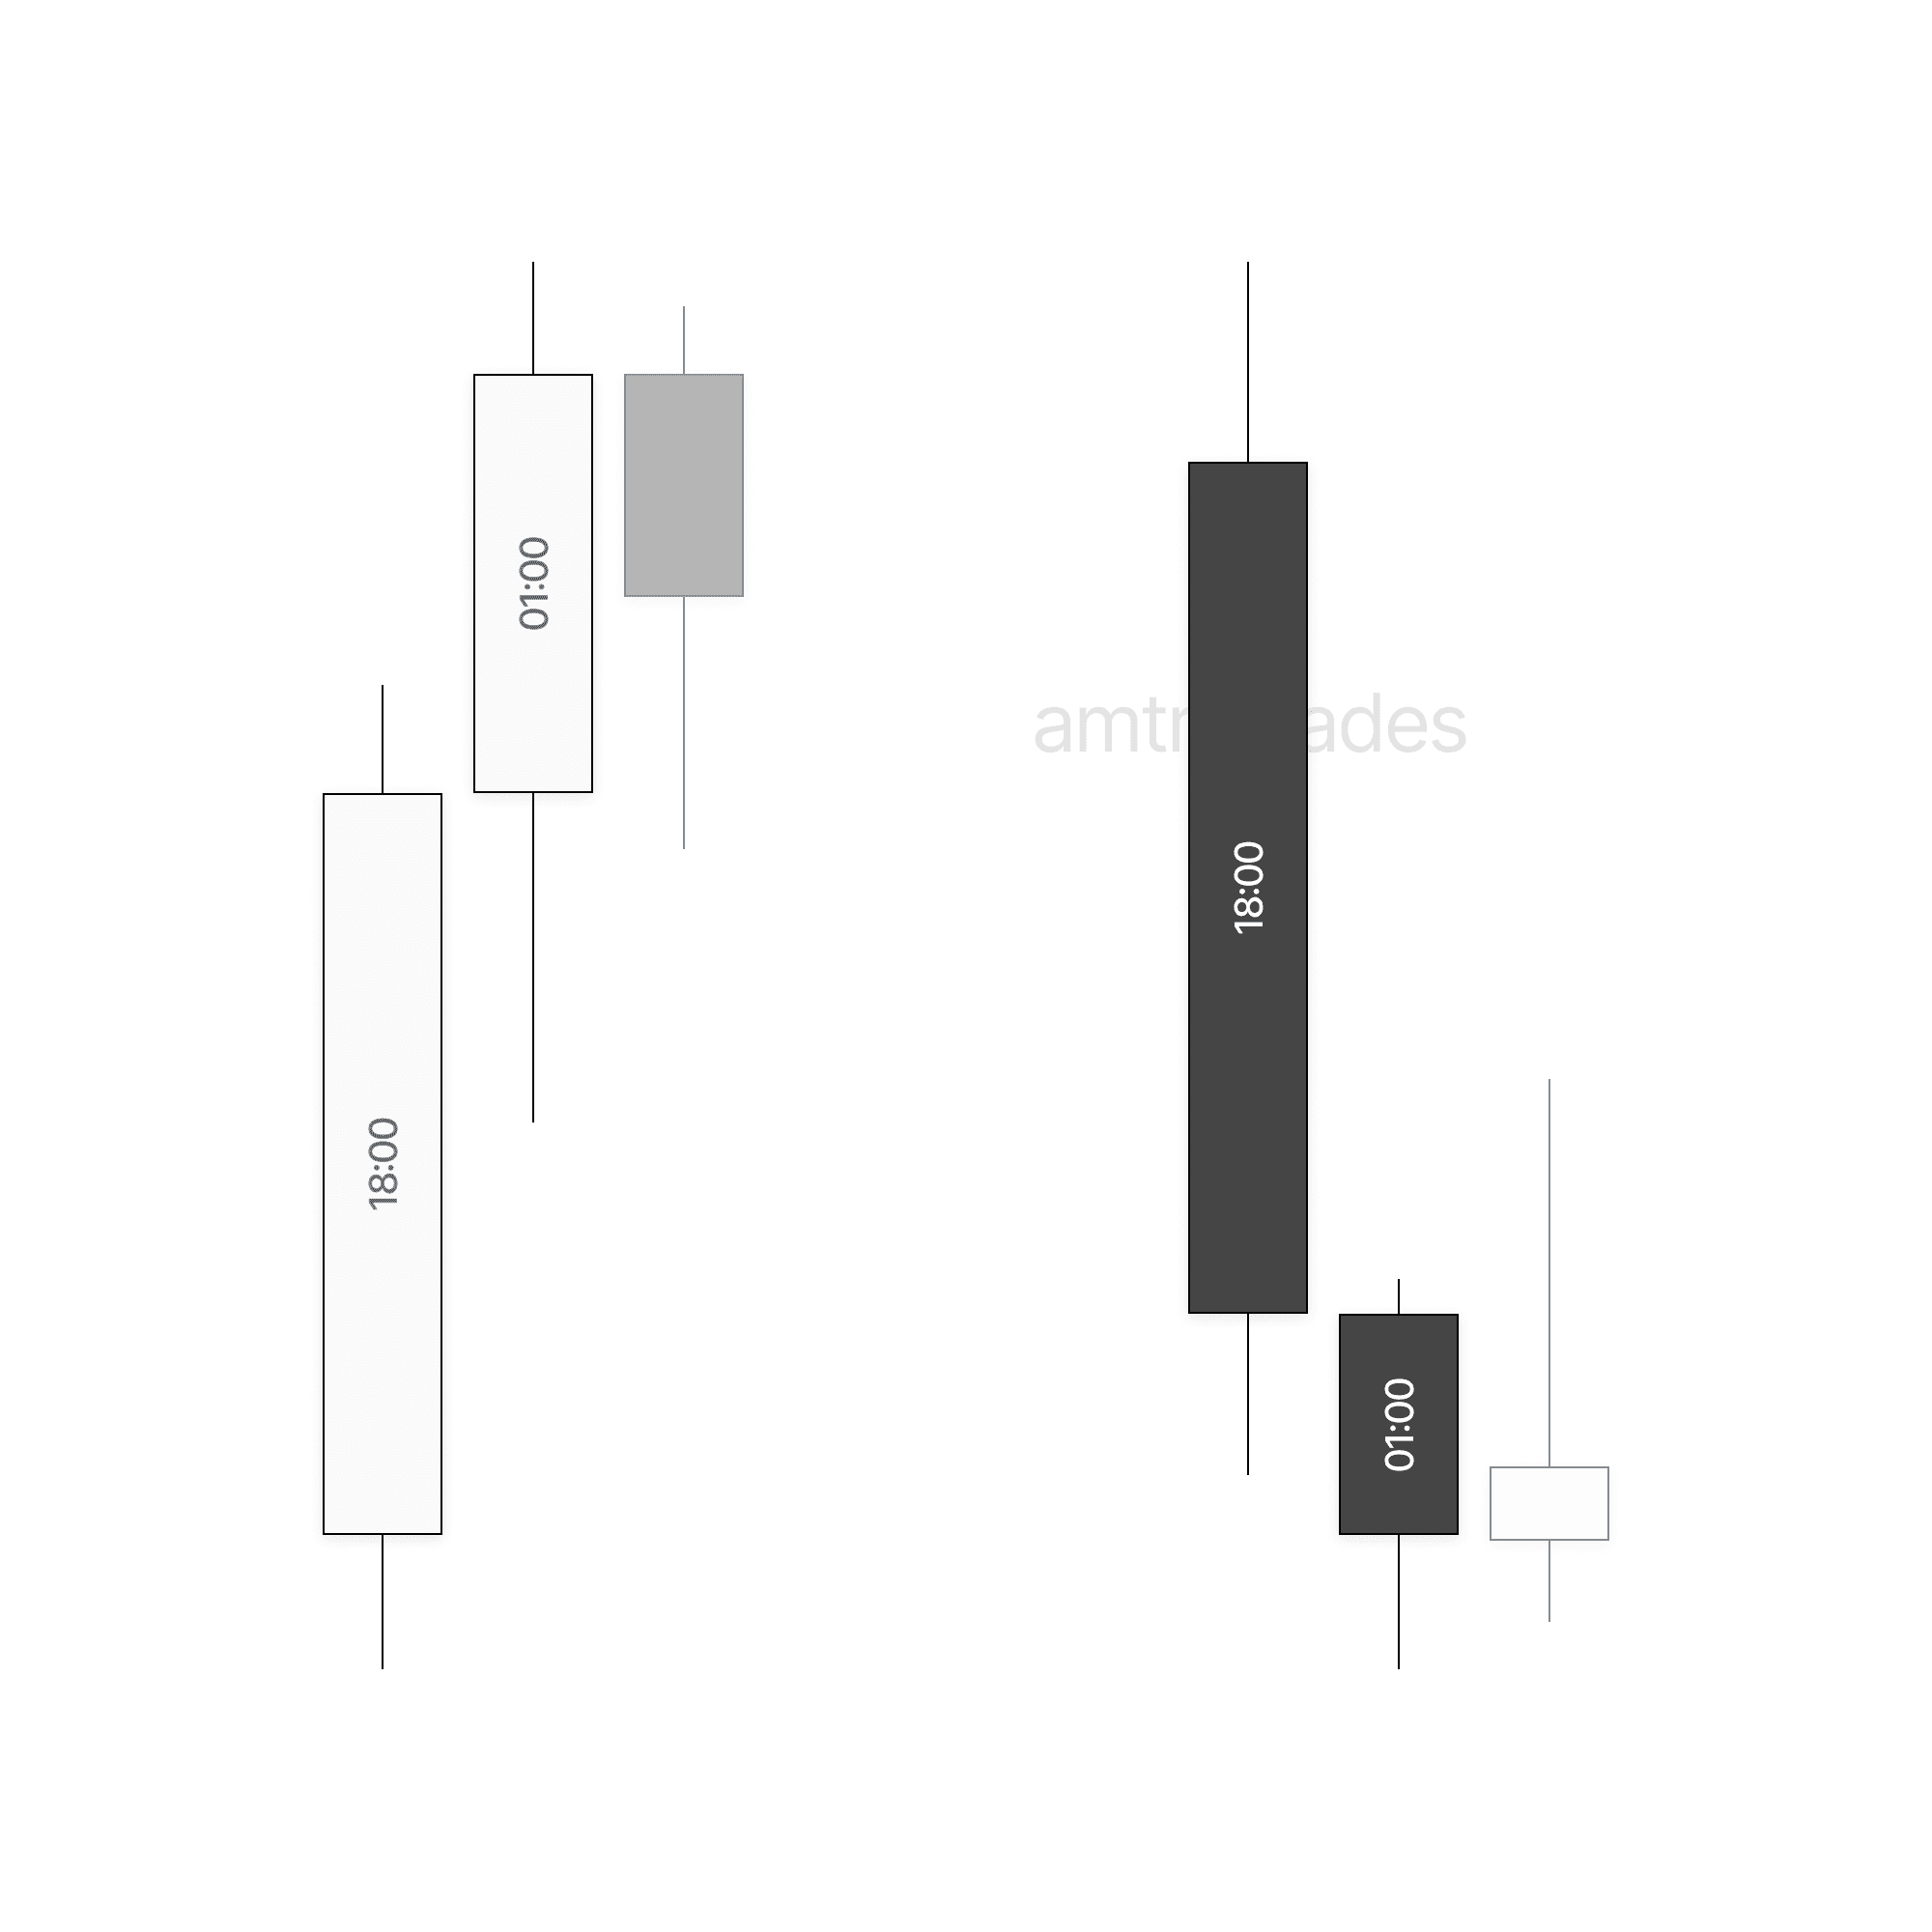
The first is the 18:00 reversal. This is when the Asia session establishes the intraday high or low and the London session expands away from it. The New York session then continues in that direction as an additional range expansion. When you see London break away from the Asia reversal, you do not need price to return to any specific level before seeking an entry in New York. The continuation is already underway because expansion days do not make deep retracements back on the intraday high or low.
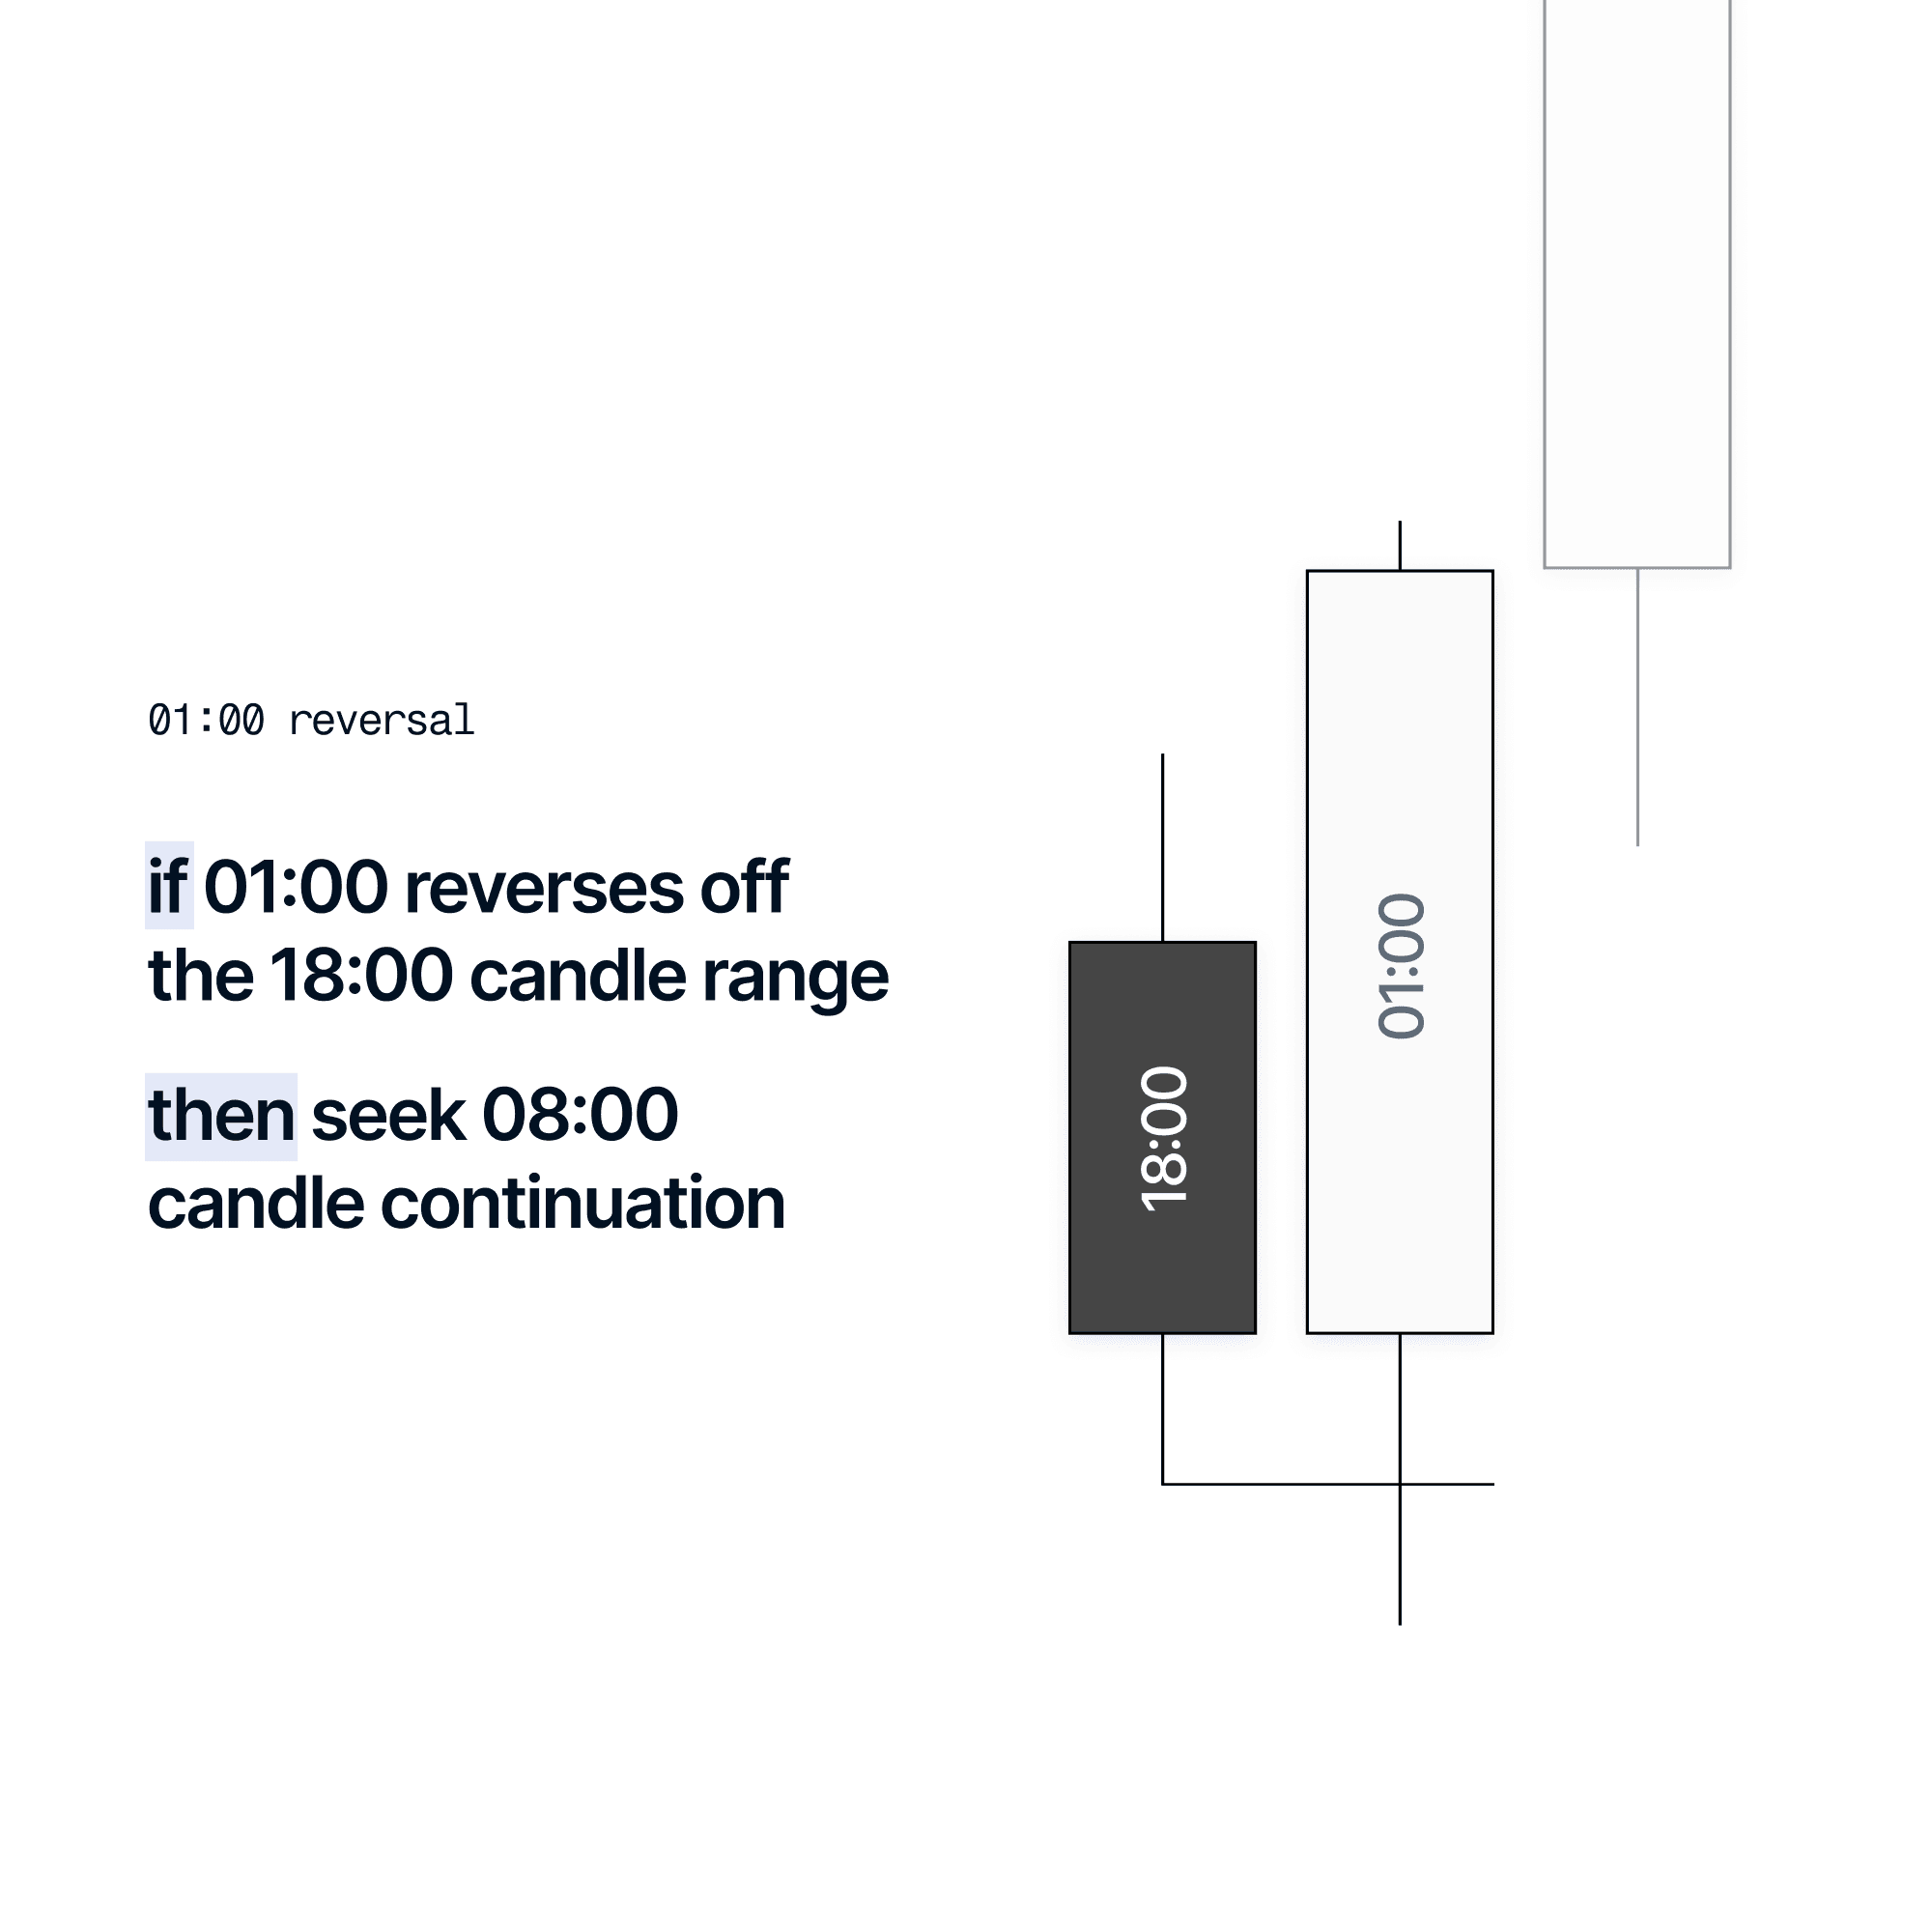
The second is the 01:00 reversal. Here, the Asia session either consolidates or forms a shallow opposing run without establishing a reversal. The London session then runs into the Asia range and reverses in the direction of the bias, forming the intraday high or low. The New York session continues from that established reversal. This is an ideal profile because London sets the high or low of day with clarity and New York has a defined directional expectation.
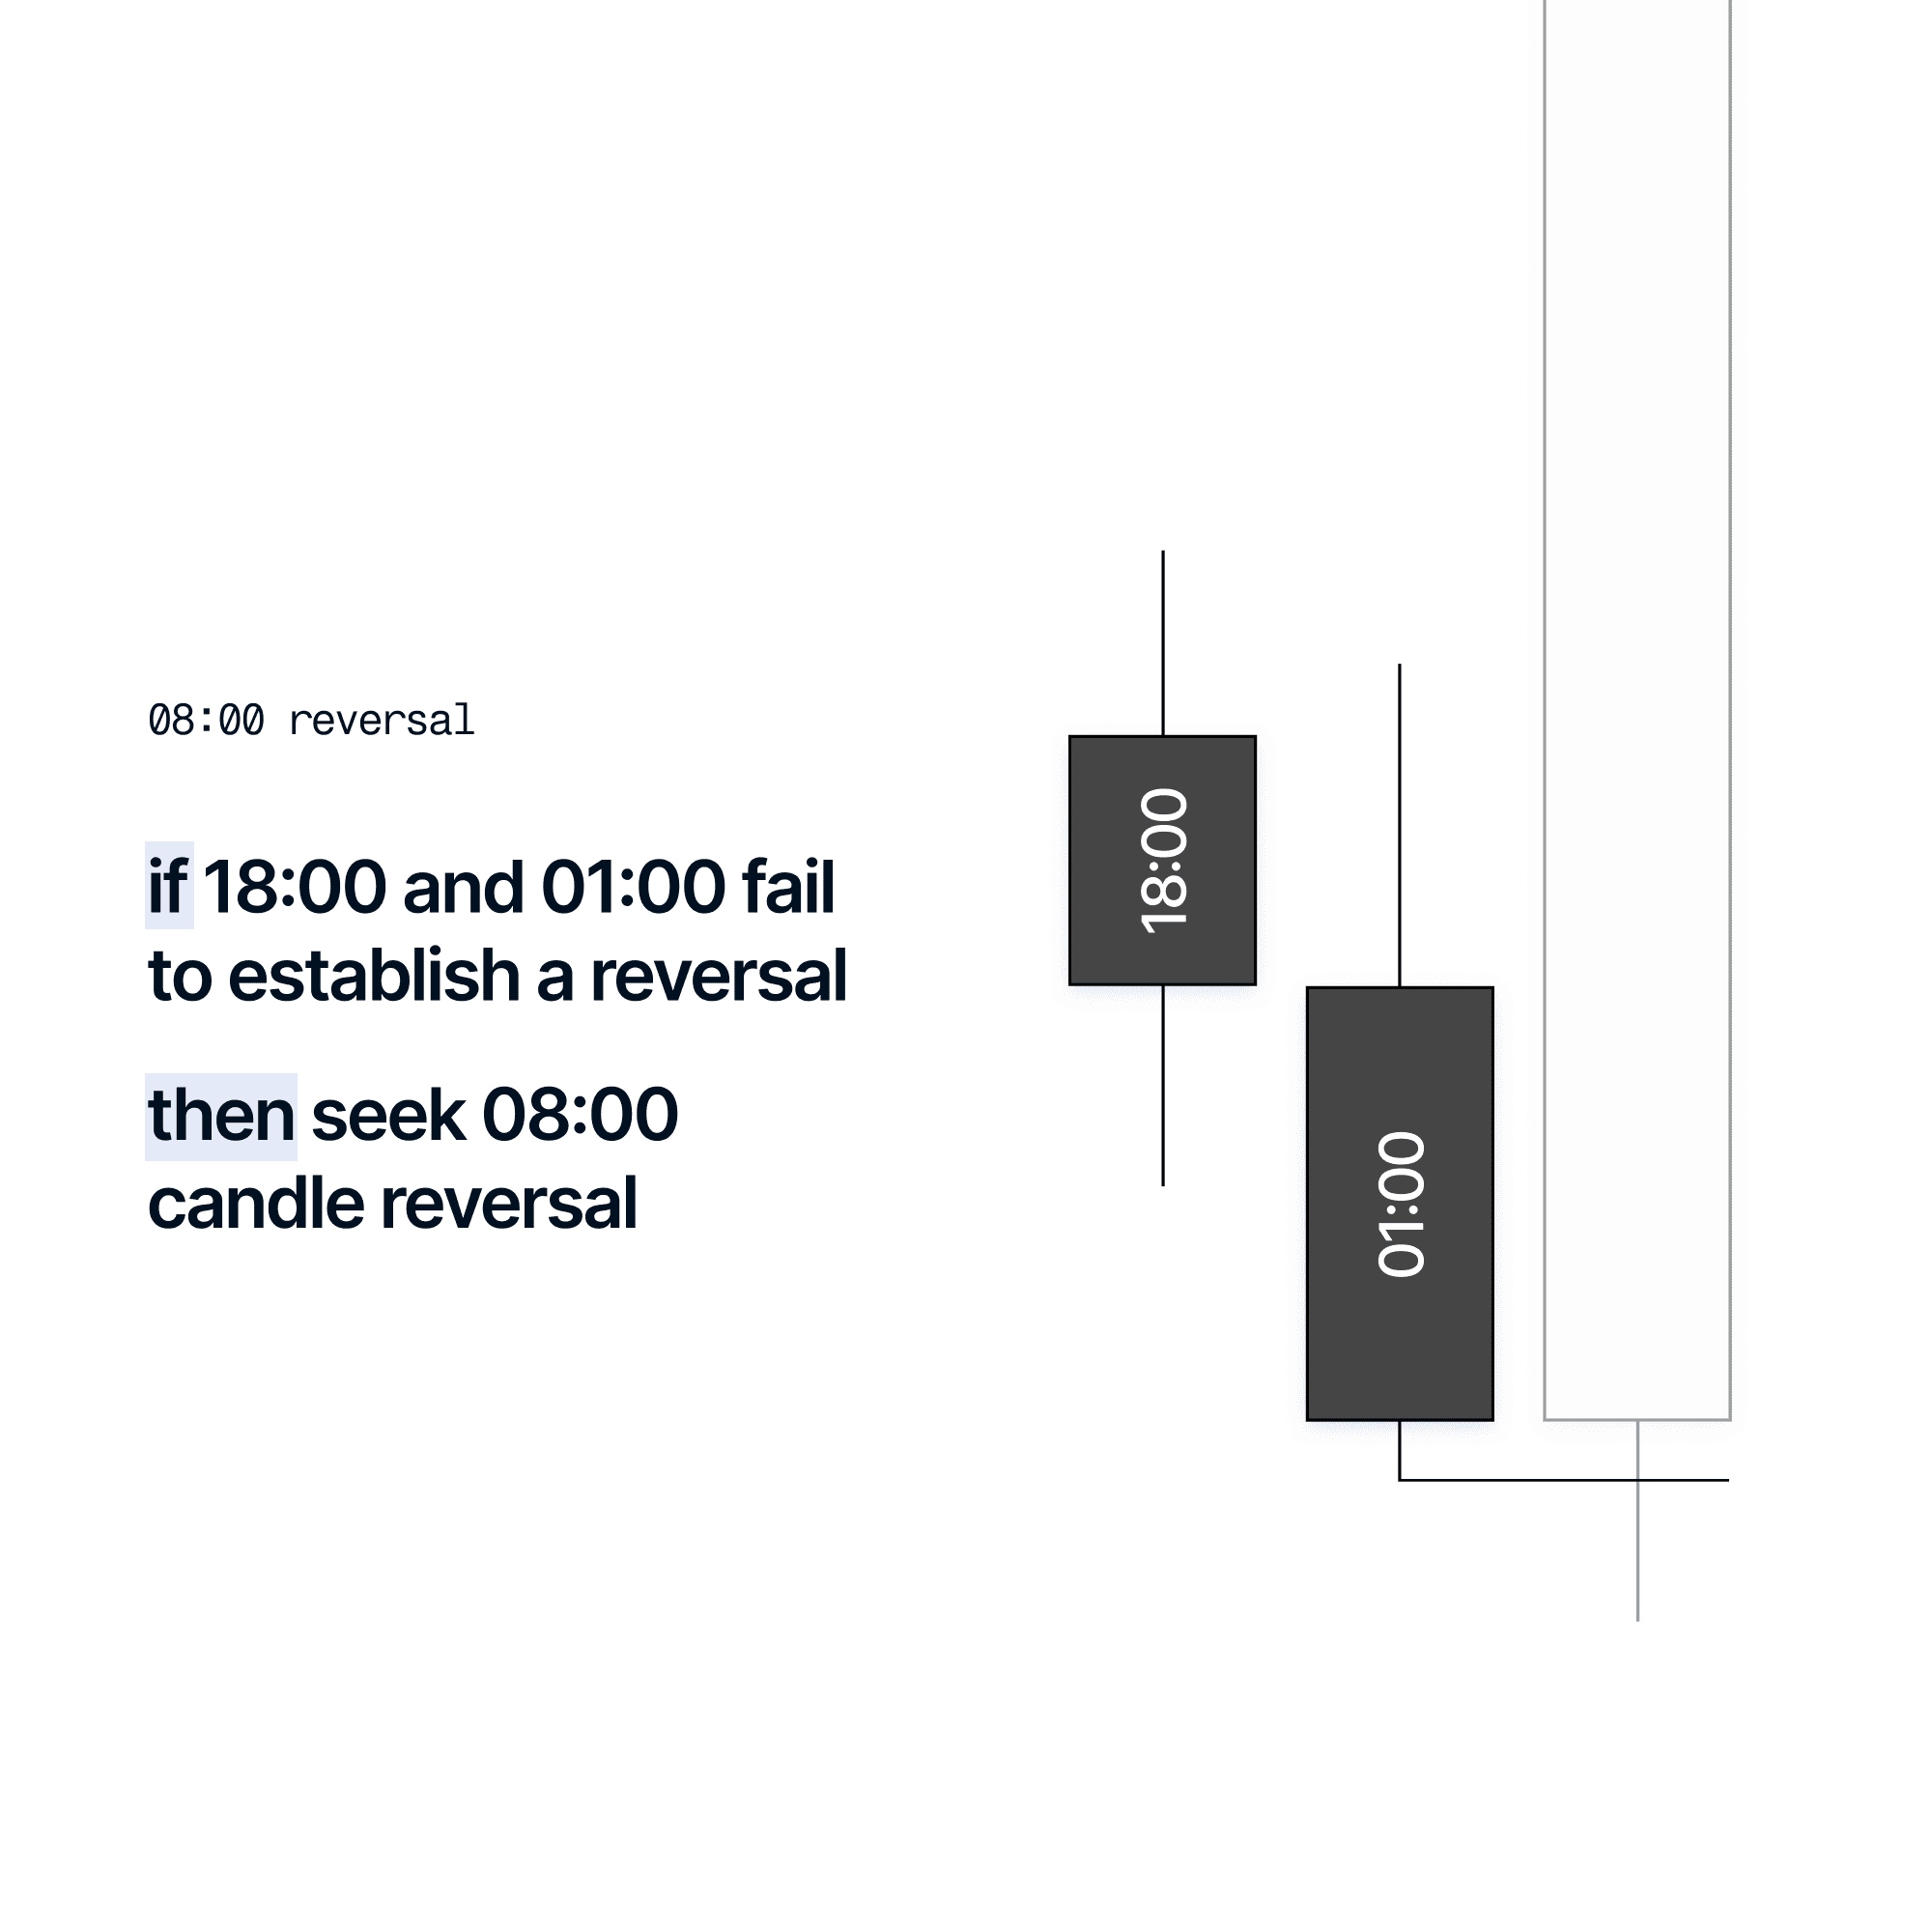
The third is the 08:00 reversal. This is when neither the Asia nor London session establishes a clear intraday reversal. Both sessions consolidate or sustain an opposing run, leaving the New York session to form the reversal before expanding. When you identify this profile developing, you know exactly what the New York session must do before any entry is considered. Price must run the intraday high or low and then confirm a reversal before the trade is available. Demand it from the market before participating.
Understanding Invalidation Profiles
There is one condition that makes a day untradeable regardless of bias. When the Asia and London sessions combined produce a range that has already captured the full expected move of the daily candle, there is nothing left for New York to expand through. This happens infrequently, but when it does it does not matter which direction the overnight expansion went or what your bias is. The conditions do not support a quality intraday trade and the day should be passed.
Real Chart Example of Aligning Daily Profiles
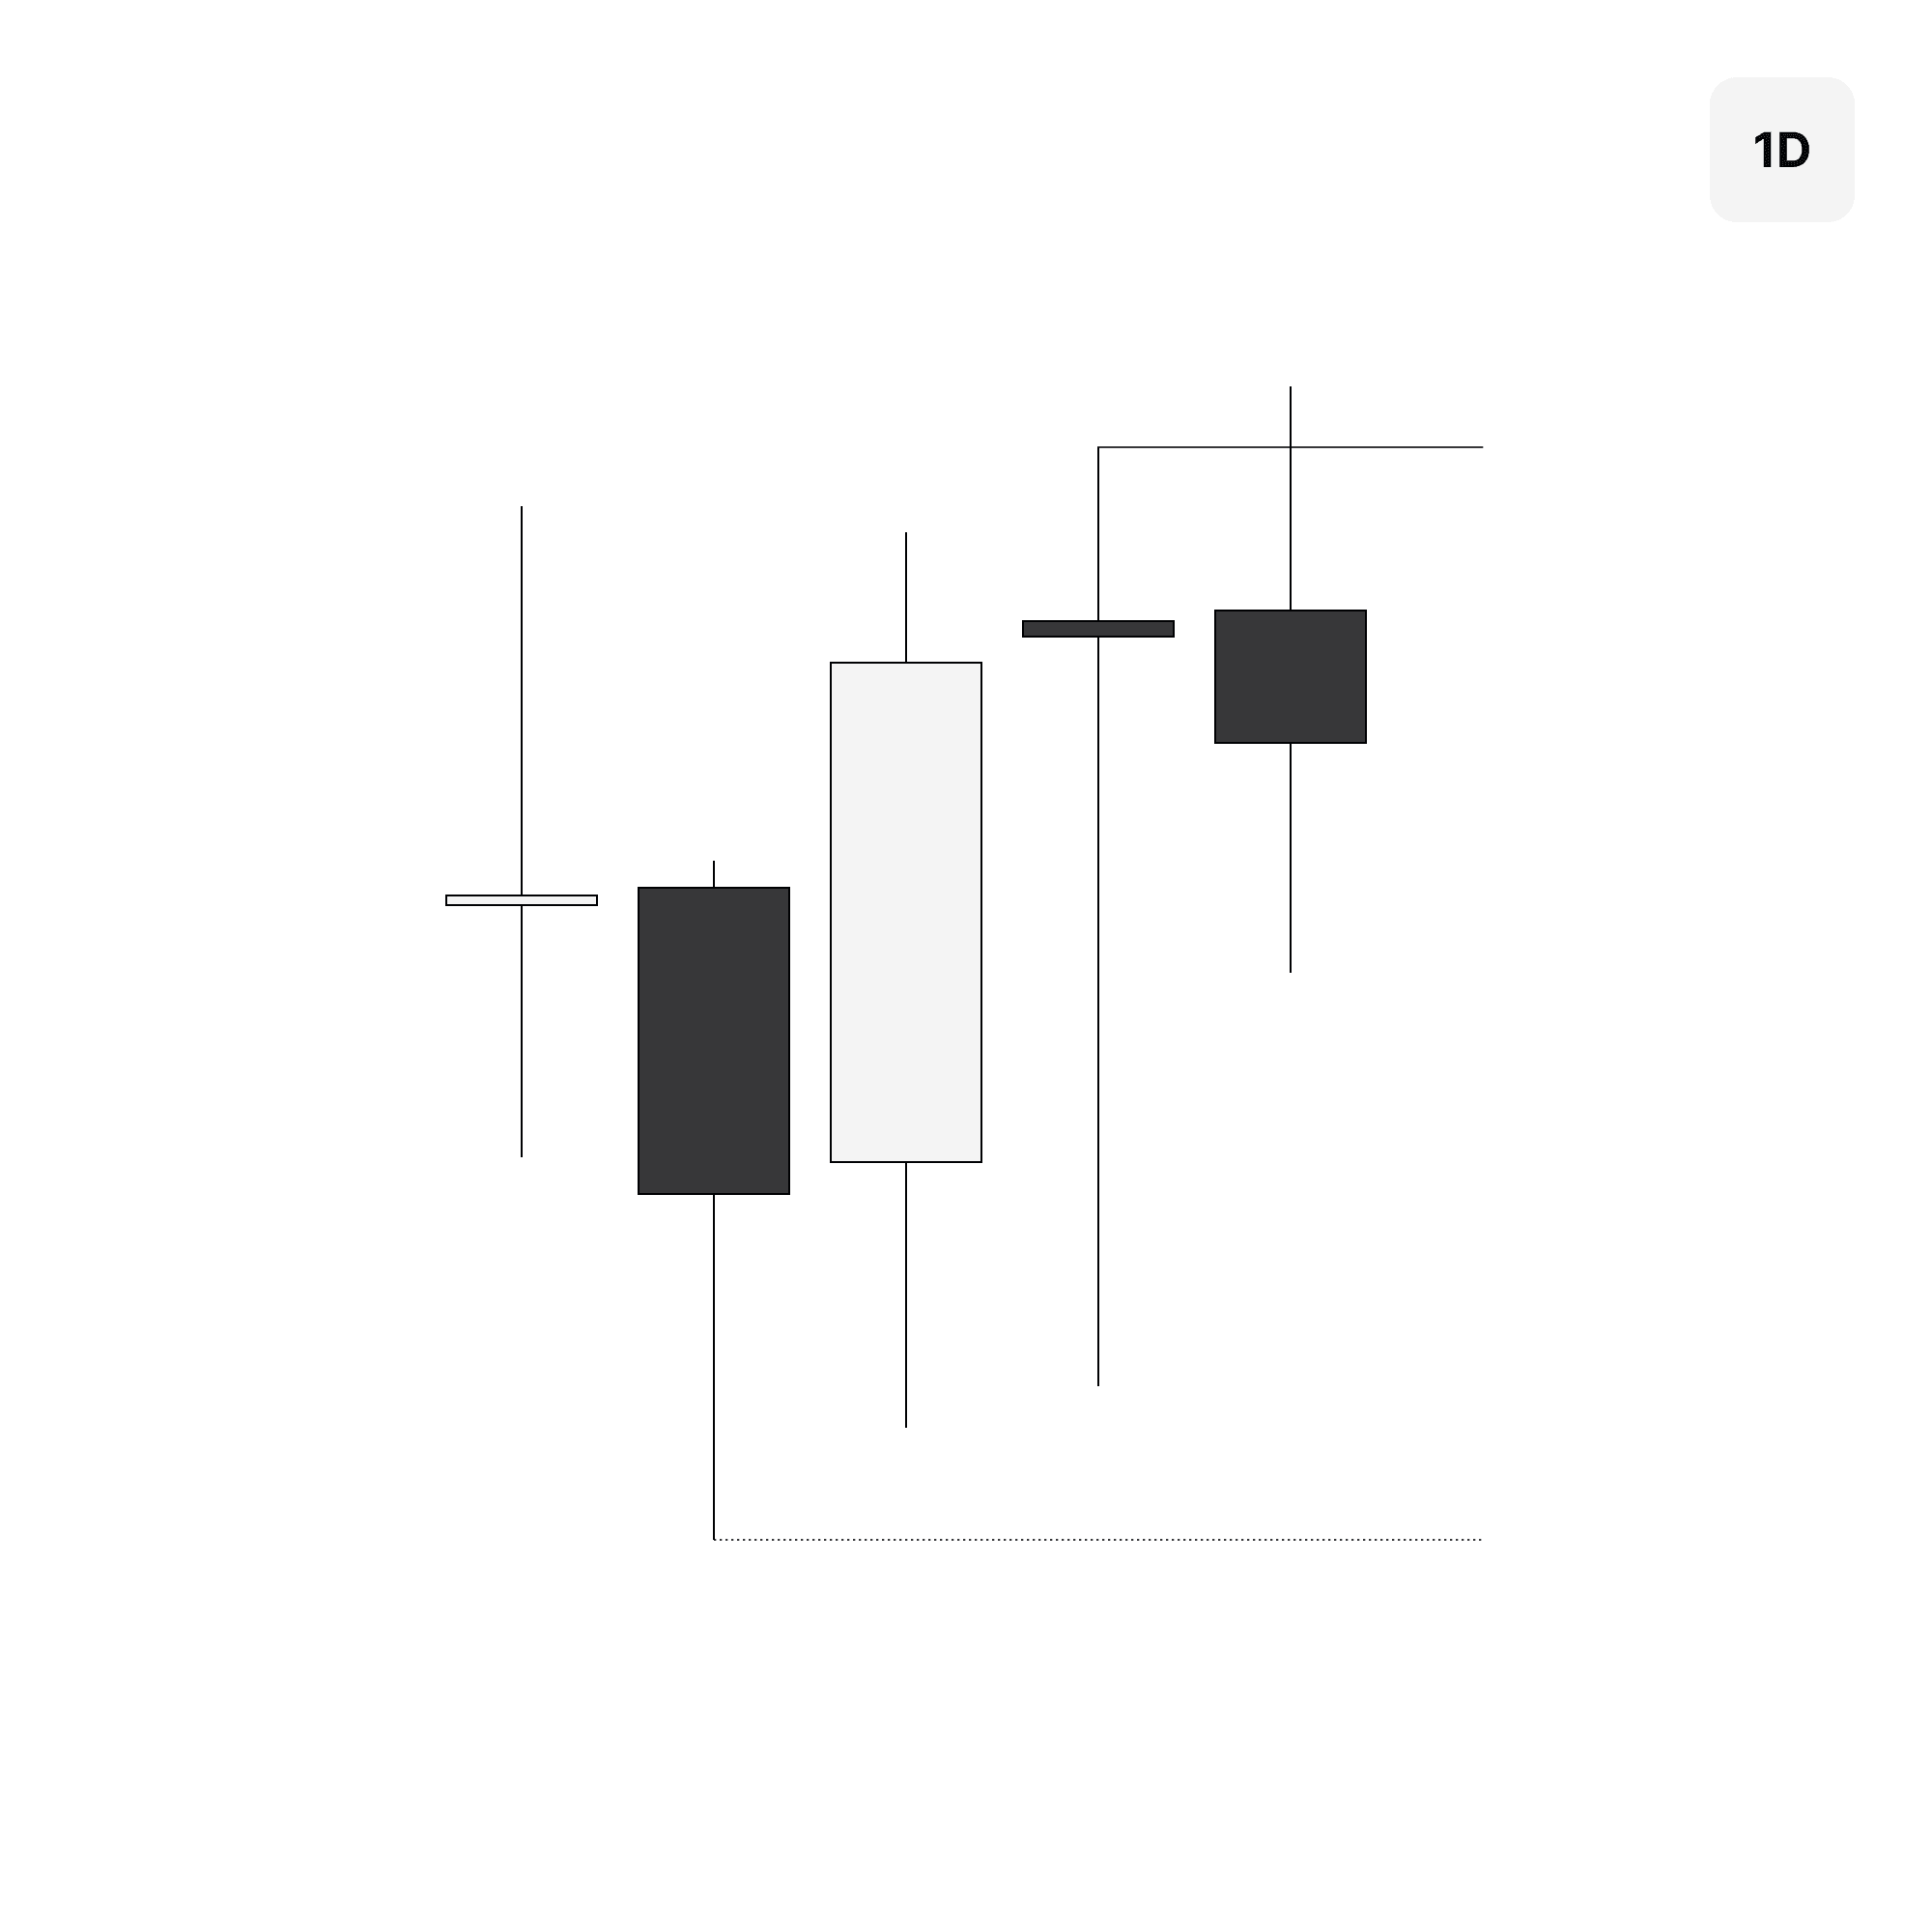
Below is a real chart example from top to bottom to understand where the daily profiles fit in the process. Starting on the daily timeframe, relevant swings are used to established the framework. The bias for the following day is bearish to trade away from the manipulation above at the relevant high and expand down into the failure swings below as a draw on price.
While we have this idea from the bias, it does not qualify an immediate entry. This is where we use the daily profile development to determine if there is confirmation to act on. Using both the 18:00 and 01:00 candle development as context, the daily profile is showing clear alignment of a bearish 18:00 reversal while the draw below remains open in the market. This provides confirmation of the bias to the downside and provides the understanding that the 08:00 candle is already in the continuation to seek an entry.
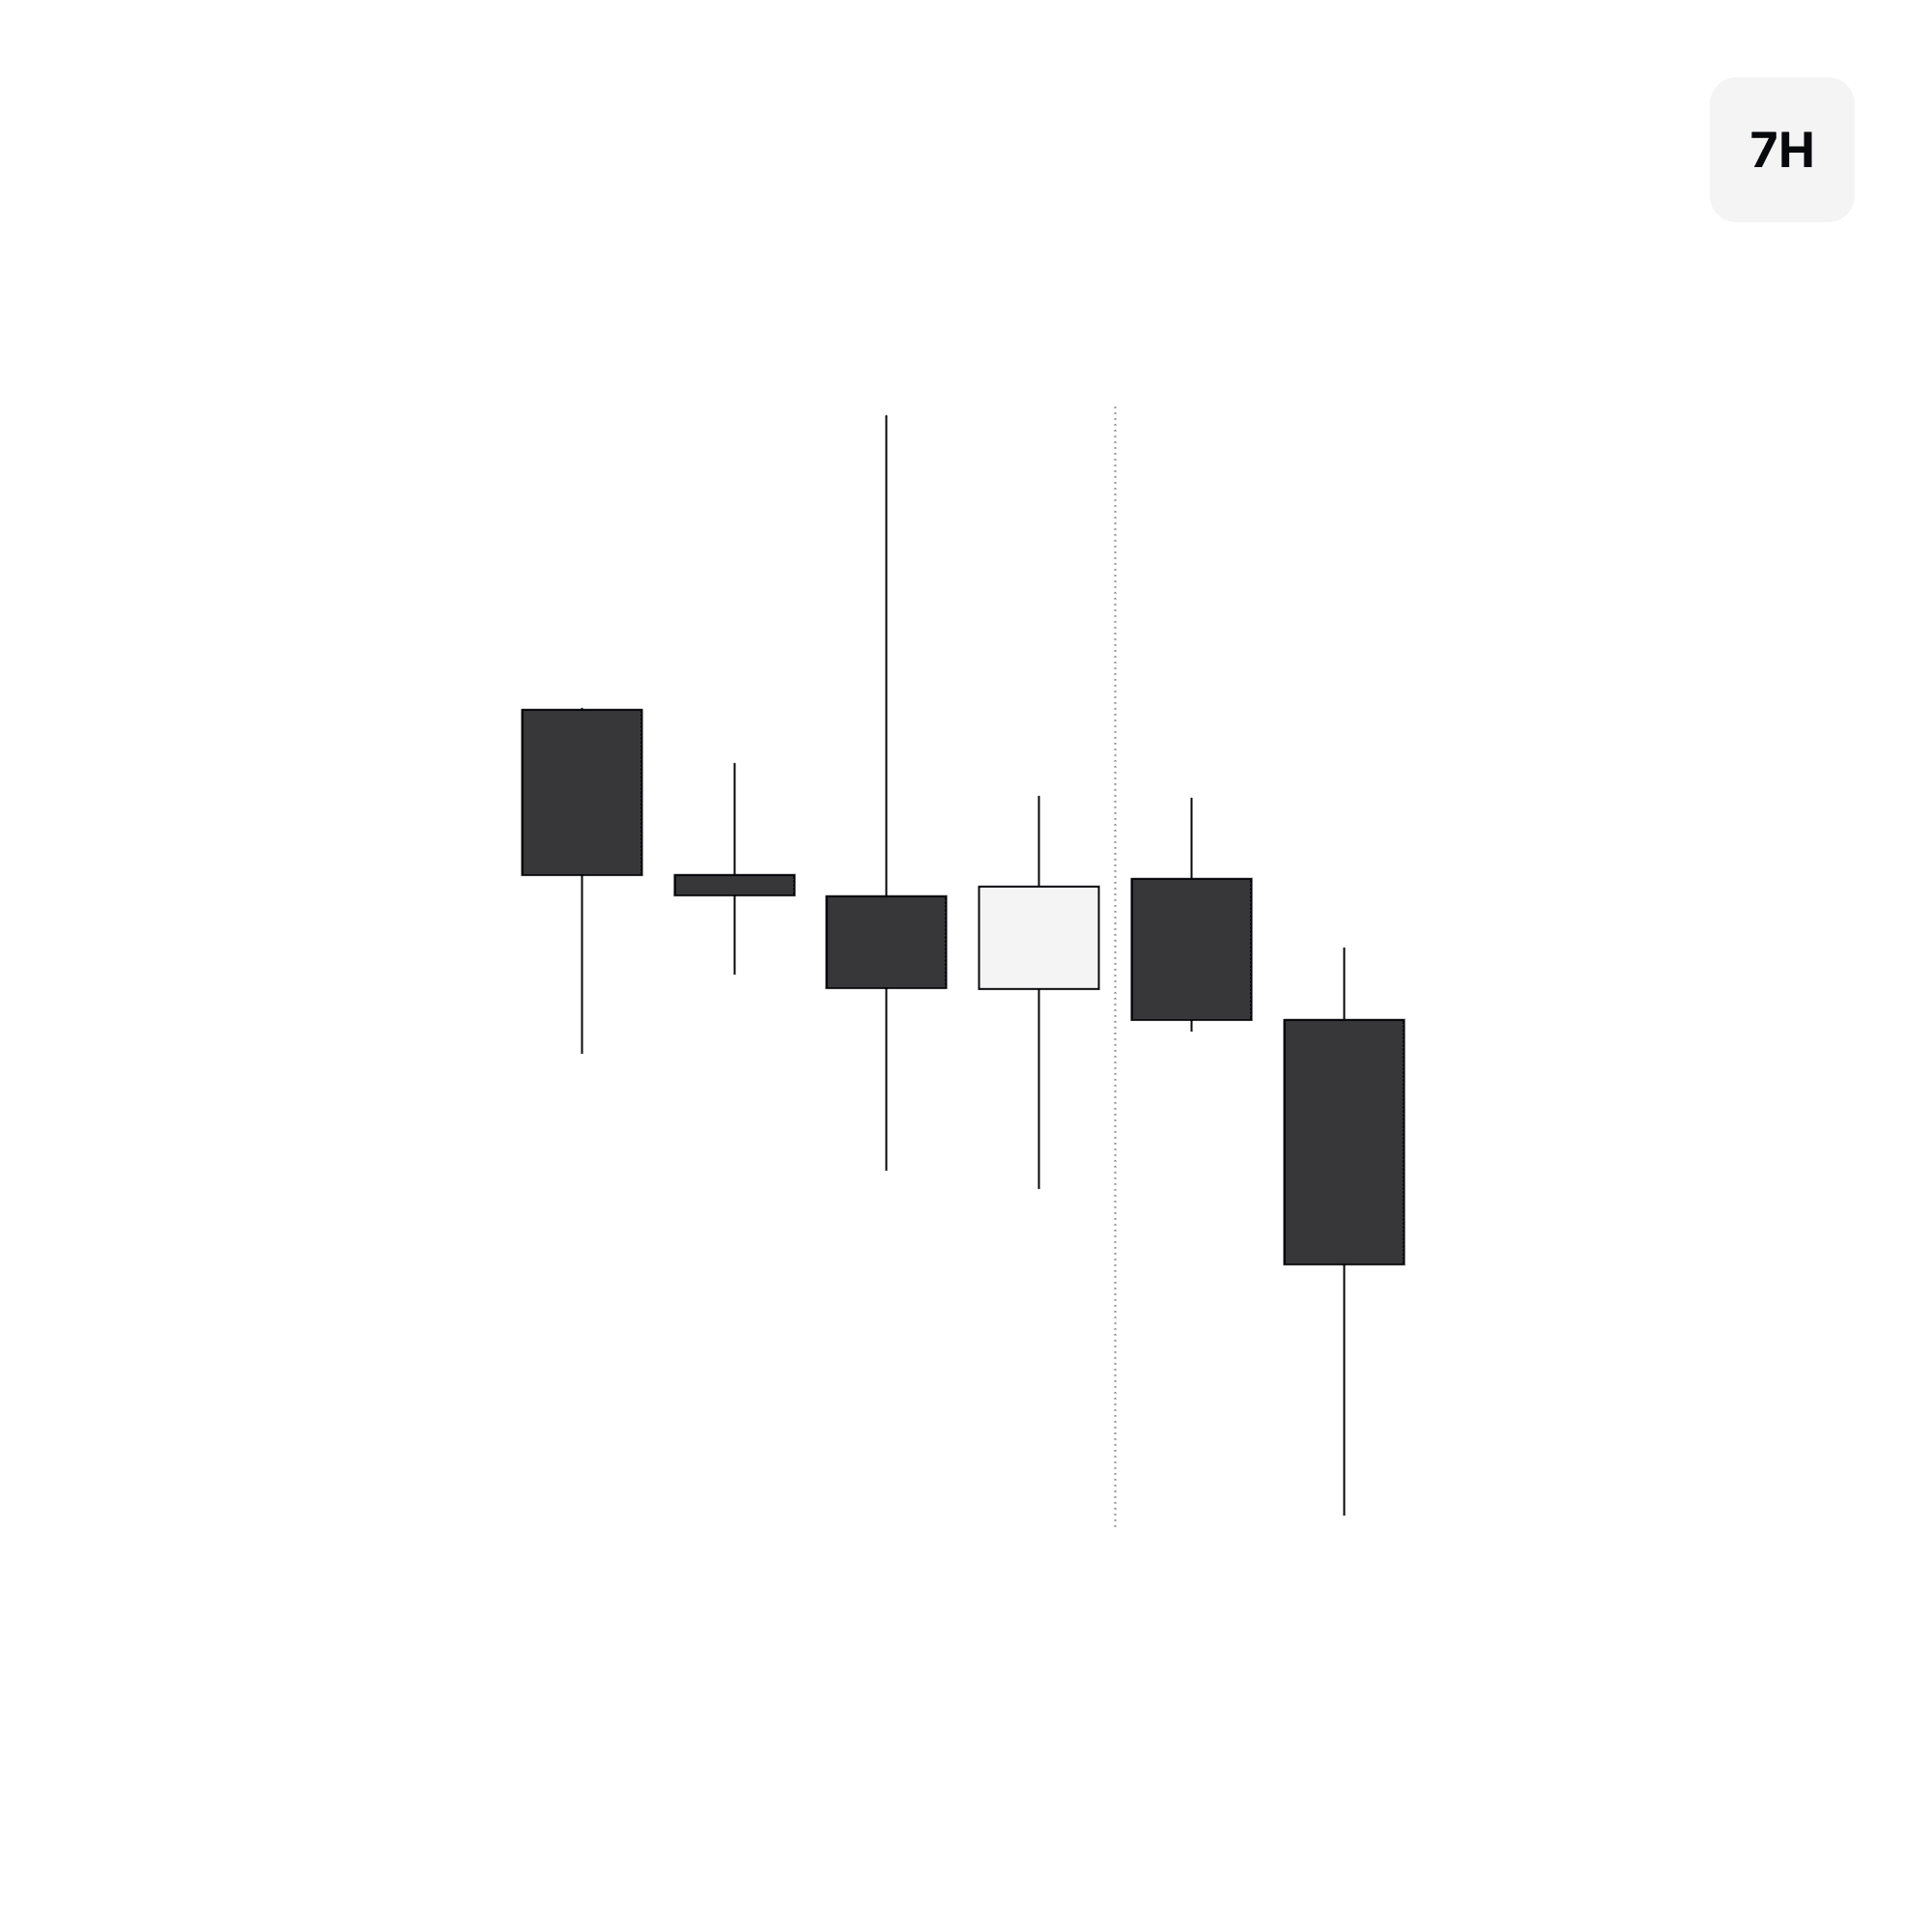
Entry becomes simple inside the New York session understanding the data behind it and how it should print within the current day based on the profile. A continuation entry is taken under the assumption that the daily candle
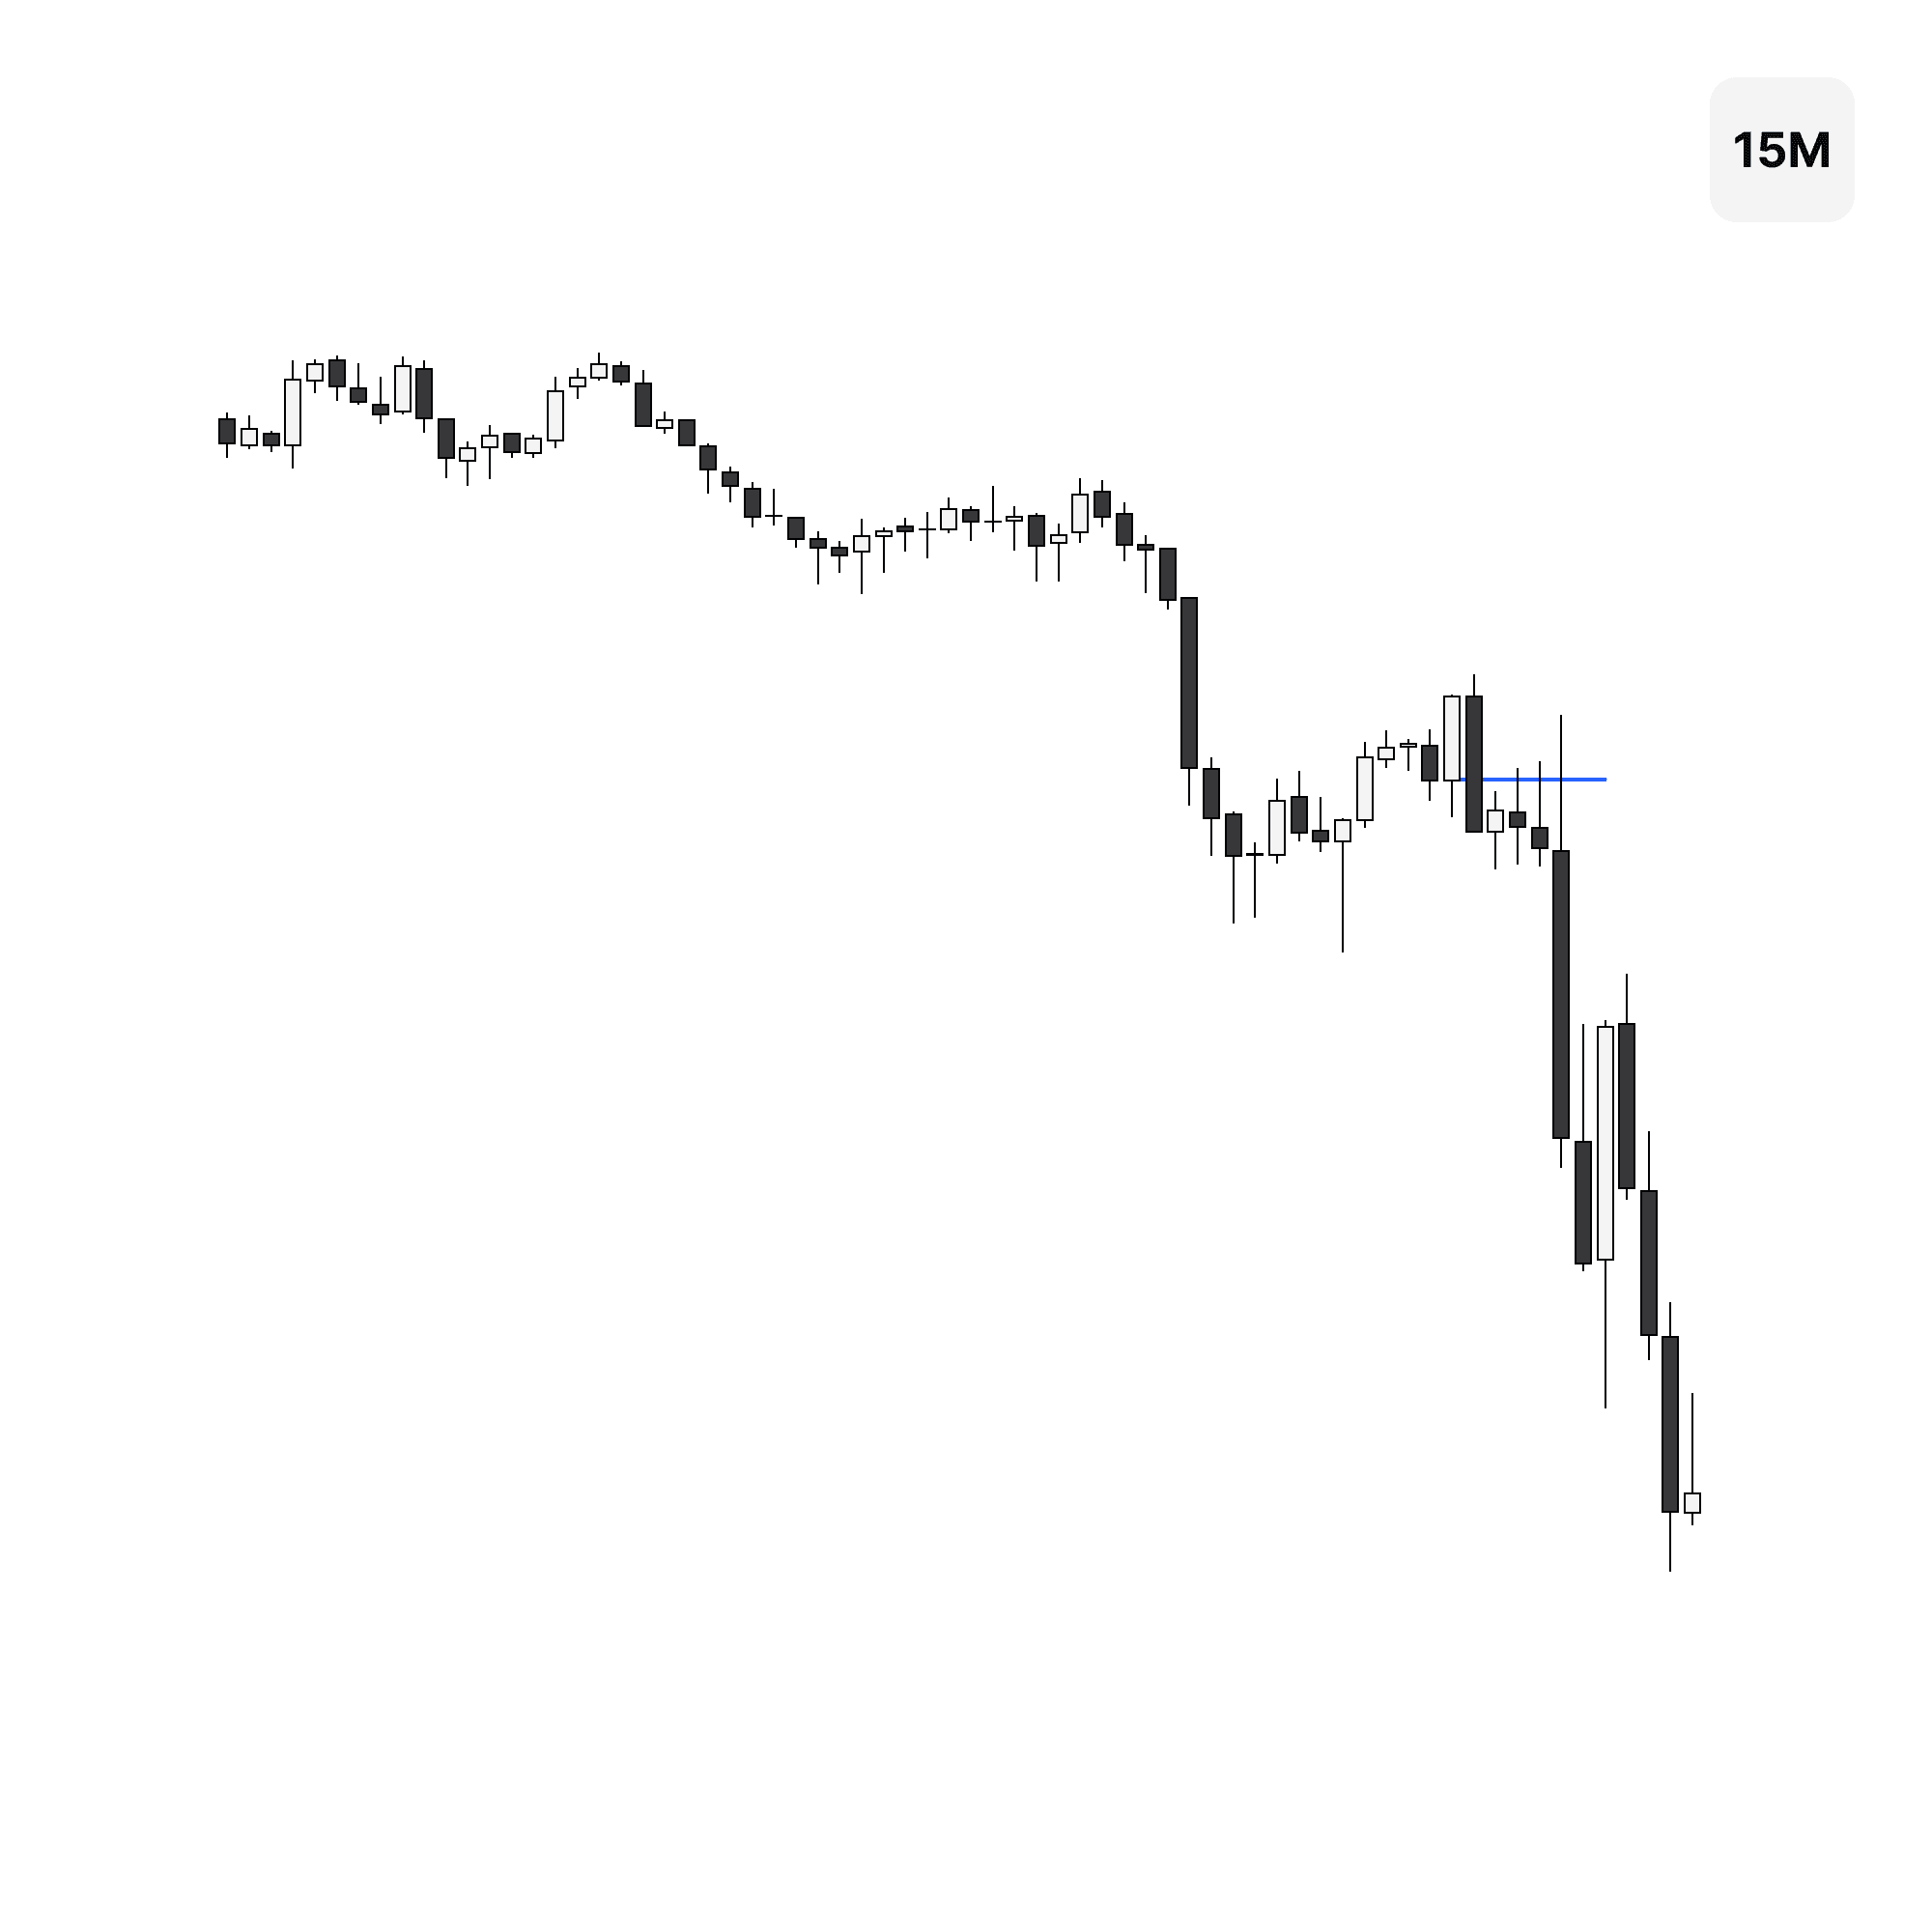
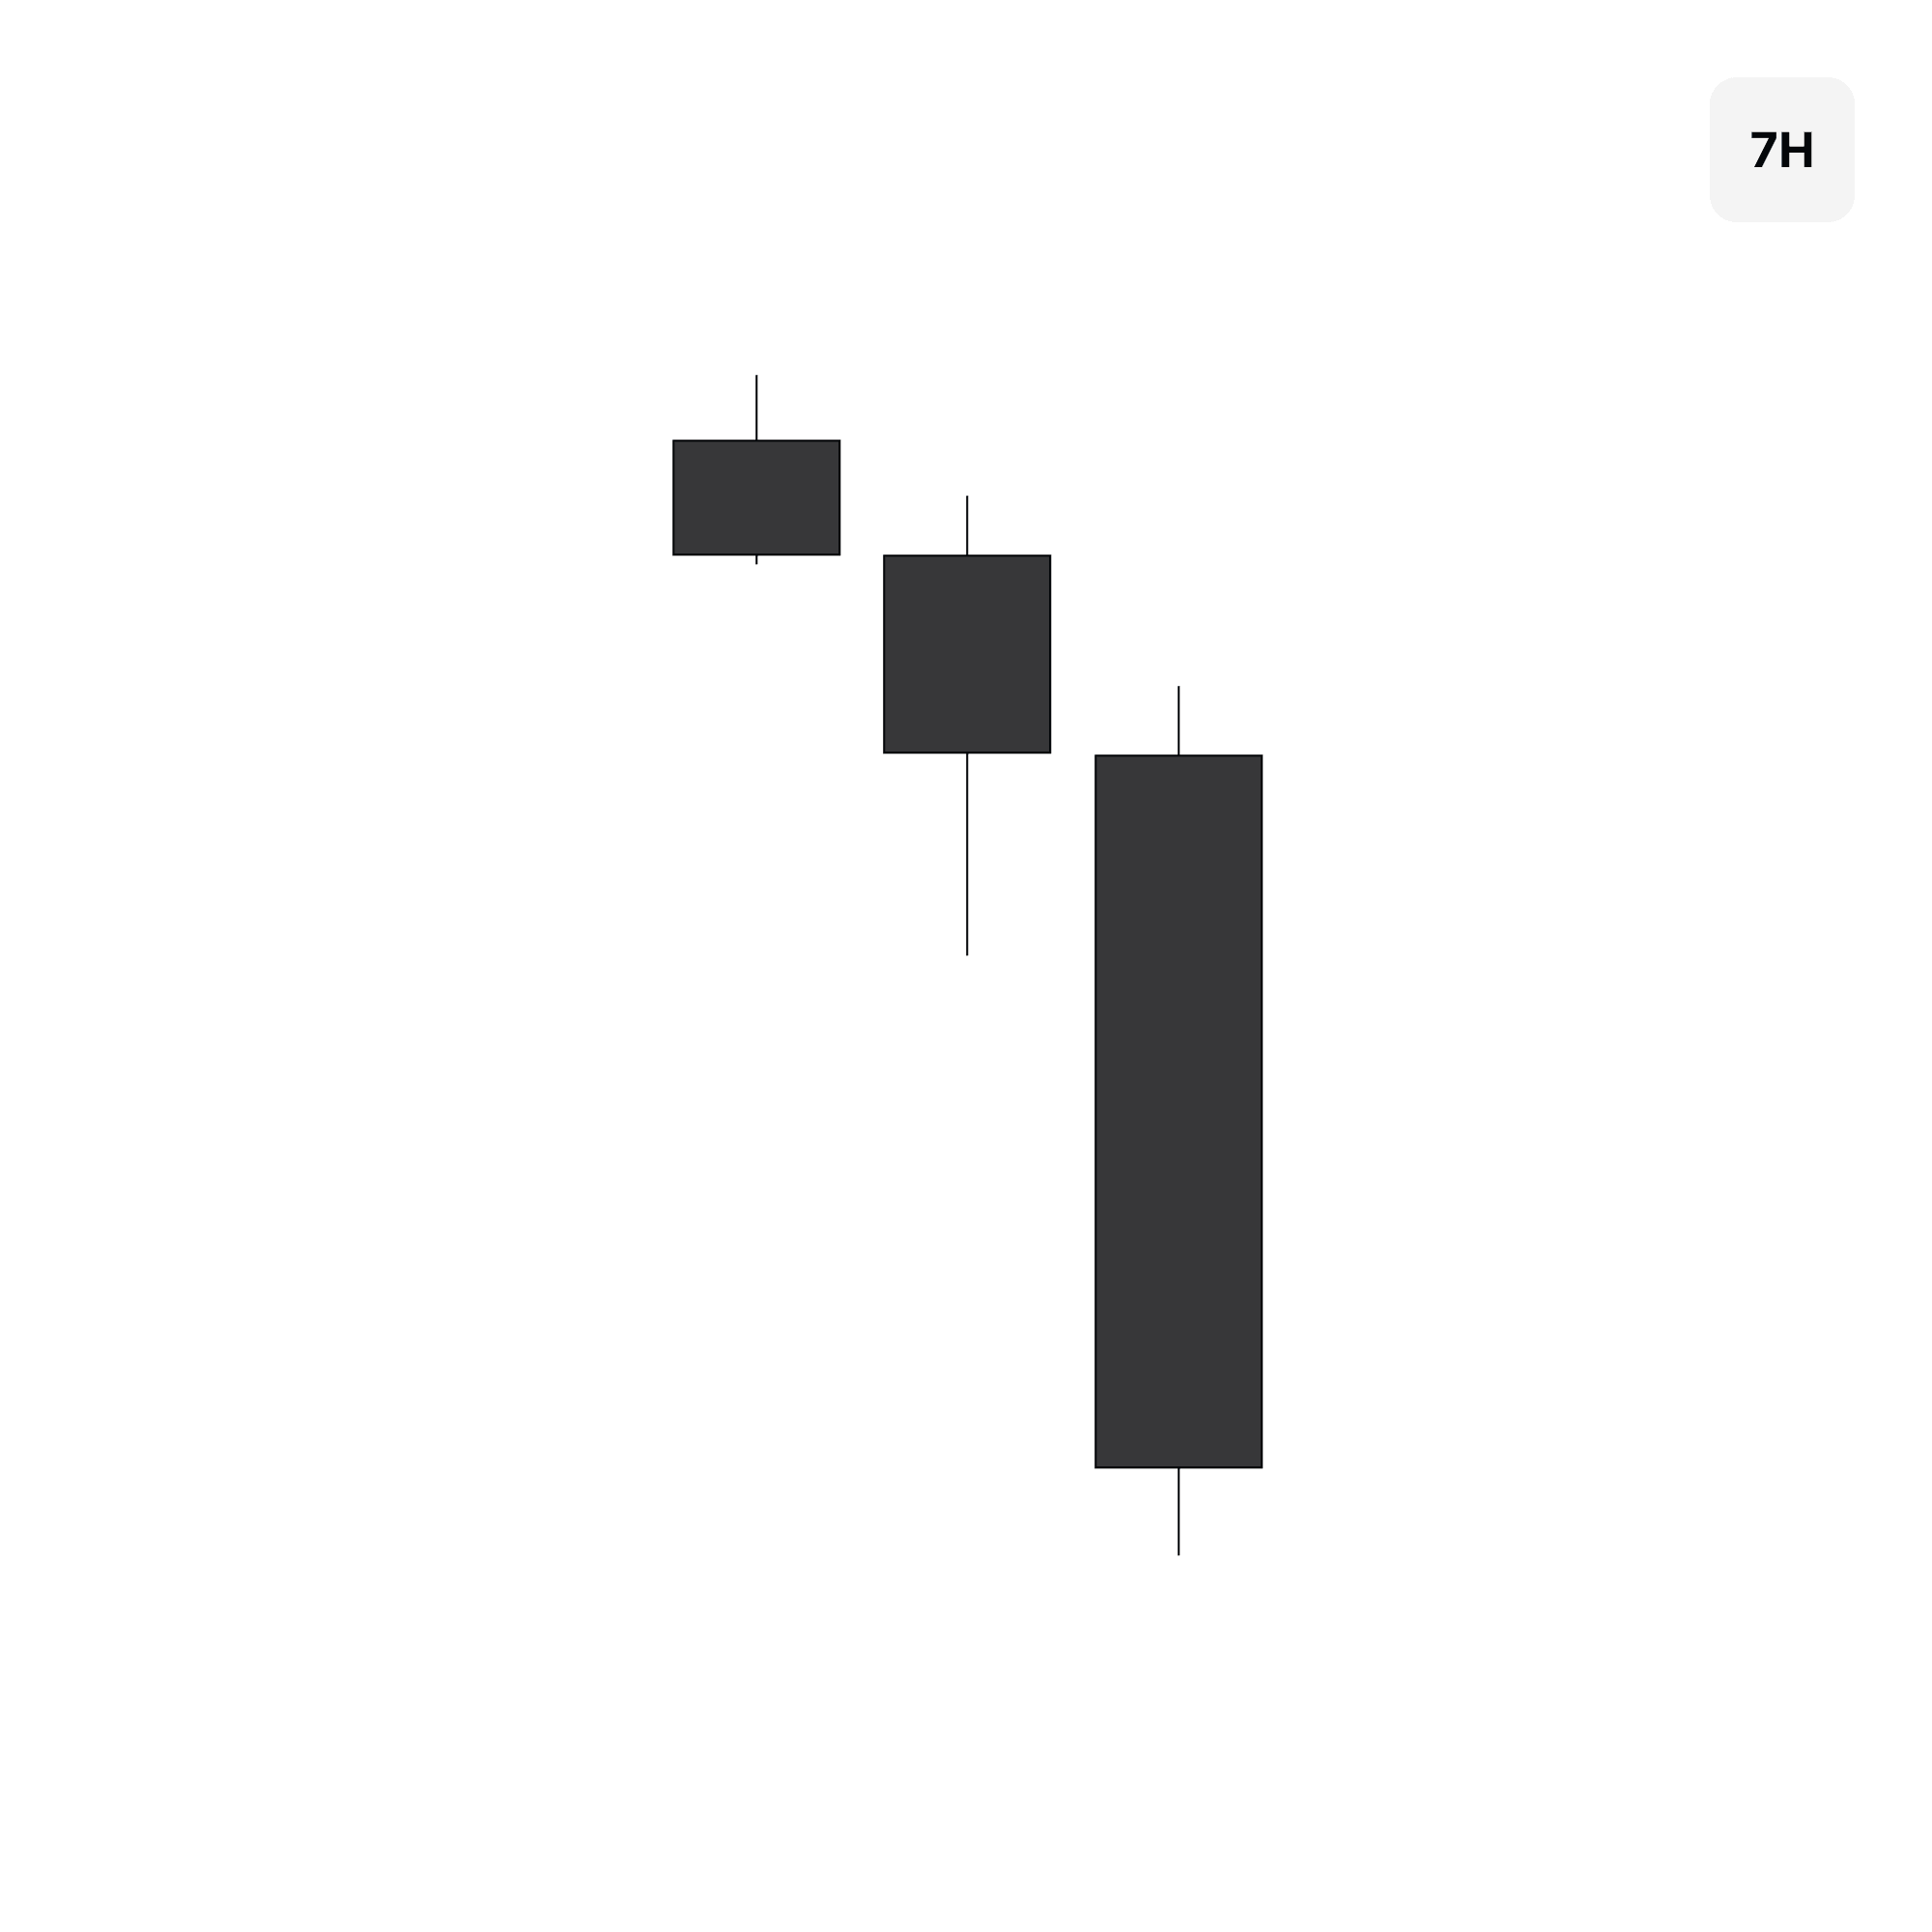
The final perspective of the 7-hour profile shows the follow through in the 08:00 candle which completes the expansion of the daily candle. This is a process that remains consistent throughout any one of the three profiles. Wait until there is clear alignment to execute within the New York session or view an invalidation and let the day go.
You can see the other real chart examples in the YouTube video below.
Prop
Learn
Explore mentorship with

AM and

TTrades
The standard of trading guidance
Prop
Learn
Get funded with the prop
firms I trade with
Use code AM for the best discount
Watch on YouTube
The Mistake Most Traders Make
Inside my system, every trade follows three layers before a position is opened: bias, confirmation, and entry. Daily profiles sit in the middle as the confirmation step.
The mistake many traders make is forming a bias off the higher timeframe and immediately looking for an entry. When you skip confirmation, two problems follow. The first is timing. Without a defined development to wait on, you have no framework for when the bias should play out or when it is no longer valid. The second is accuracy. Your bias will not be correct every time. Days where the bias is wrong but a daily profile never confirms means you never execute. You avoid the loss entirely without needing to predict anything.
Daily profiles move you away from being a predictor of the market. They give you a structured process to follow so that execution only happens when there is reason to act, not just because a higher timeframe idea exists.
The Logic of the Daily Market Sessions
To understand daily profiles, you first need to understand the sessions that make up each daily candle. The daily candle is divided into three sessions. Asia runs from 18:00 to 01:00. London runs from 01:00 to 08:00. New York runs from 08:00 to close. All times in Eastern Standard (EST). Each session is a 7-hour window, and using a 7-hour timeframe on your chart gives you three candles that represent each session individually.
This timeframe is used because it captures session logic. The market recognizes session opens and key news times. Using the 7-hour chart gives relevance to the candles being analyzed.
The data behind these sessions makes the logic clear. The Asia session accounts for roughly 17% of the average daily range. London accounts for 23%. New York accounts for 60%. When it comes to closing in the direction of the daily candle, Asia does so 58% of the time, London 62%, and New York 86%. This is why inside of the daily profile we use the 18:00 candle as the opening context, the 01:00 candle development to determine the profile, and execute within the 08:00 candle.
New York makes the majority of the daily range and is the most likely session to close in the direction of the daily candle by a significant margin. That is where execution focus belongs.
The Three Daily Profiles to Seek
There are three profiles that confirm a bias is developing in a way that is likely to follow through. Each one tells you something specific about where the intraday reversal is forming and what the New York session should do. Once a bias is established, demand clear alignment of one of the three profiles. Ignore anything else.
The first is the 18:00 reversal. This is when the Asia session establishes the intraday high or low and the London session expands away from it. The New York session then continues in that direction as an additional range expansion. When you see London break away from the Asia reversal, you do not need price to return to any specific level before seeking an entry in New York. The continuation is already underway because expansion days do not make deep retracements back on the intraday high or low.
The second is the 01:00 reversal. Here, the Asia session either consolidates or forms a shallow opposing run without establishing a reversal. The London session then runs into the Asia range and reverses in the direction of the bias, forming the intraday high or low. The New York session continues from that established reversal. This is an ideal profile because London sets the high or low of day with clarity and New York has a defined directional expectation.
The third is the 08:00 reversal. This is when neither the Asia nor London session establishes a clear intraday reversal. Both sessions consolidate or sustain an opposing run, leaving the New York session to form the reversal before expanding. When you identify this profile developing, you know exactly what the New York session must do before any entry is considered. Price must run the intraday high or low and then confirm a reversal before the trade is available. Demand it from the market before participating.
Understanding Invalidation Profiles
There is one condition that makes a day untradeable regardless of bias. When the Asia and London sessions combined produce a range that has already captured the full expected move of the daily candle, there is nothing left for New York to expand through. This happens infrequently, but when it does it does not matter which direction the overnight expansion went or what your bias is. The conditions do not support a quality intraday trade and the day should be passed.
Real Chart Example of Aligning Daily Profiles
Below is a real chart example from top to bottom to understand where the daily profiles fit in the process. Starting on the daily timeframe, relevant swings are used to established the framework. The bias for the following day is bearish to trade away from the manipulation above at the relevant high and expand down into the failure swings below as a draw on price.
While we have this idea from the bias, it does not qualify an immediate entry. This is where we use the daily profile development to determine if there is confirmation to act on. Using both the 18:00 and 01:00 candle development as context, the daily profile is showing clear alignment of a bearish 18:00 reversal while the draw below remains open in the market. This provides confirmation of the bias to the downside and provides the understanding that the 08:00 candle is already in the continuation to seek an entry.
Entry becomes simple inside the New York session understanding the data behind it and how it should print within the current day based on the profile. A continuation entry is taken under the assumption that the daily candle
The final perspective of the 7-hour profile shows the follow through in the 08:00 candle which completes the expansion of the daily candle. This is a process that remains consistent throughout any one of the three profiles. Wait until there is clear alignment to execute within the New York session or view an invalidation and let the day go.
You can see the other real chart examples in the YouTube video below.
Prop
Learn
Get funded with the prop firms I trade with
Use code AM for the best discount


Prop
Learn
Explore mentorship with
AM and
TTrades

Prop
Learn
Get funded with the prop firms I trade with
Use code AM for the best discount
Prop
Learn
Explore mentorship with
AM and
TTrades
Prop
Learn
Explore mentorship with
AM and
TTrades
The standard of trading guidance
Prop
Learn
Get funded with the prop
firms I trade with
Use code AM for the best discount
Prop
Learn
Explore mentorship with
AM and
TTrades
The standard of trading guidance
Prop
Learn
Get funded with the prop
firms I trade with
Use code AM for the best discount

How I Mechanically Confirm Daily Bias
Continue Learning.


© 2026 AM Trades. All Rights Reserved.
© 2026 AM Trades. All Rights Reserved.


© 2026 AM Trades. All Rights Reserved.