


The Ideal Reversal and Continuation Setups
Trades
The Ideal Reversal and Continuation Setups
A clear breakdown of a high-probability trading setup built on daily framework and session-based confirmation. The process shows how to identify valid bias using relevant swings, confirm direction with daily profiles, and then refine entries within the New York session. Real trade examples and live execution clips will reinforce how to apply the system with detachment from emotions.

Ideal Reversal Day Trade Breakdown
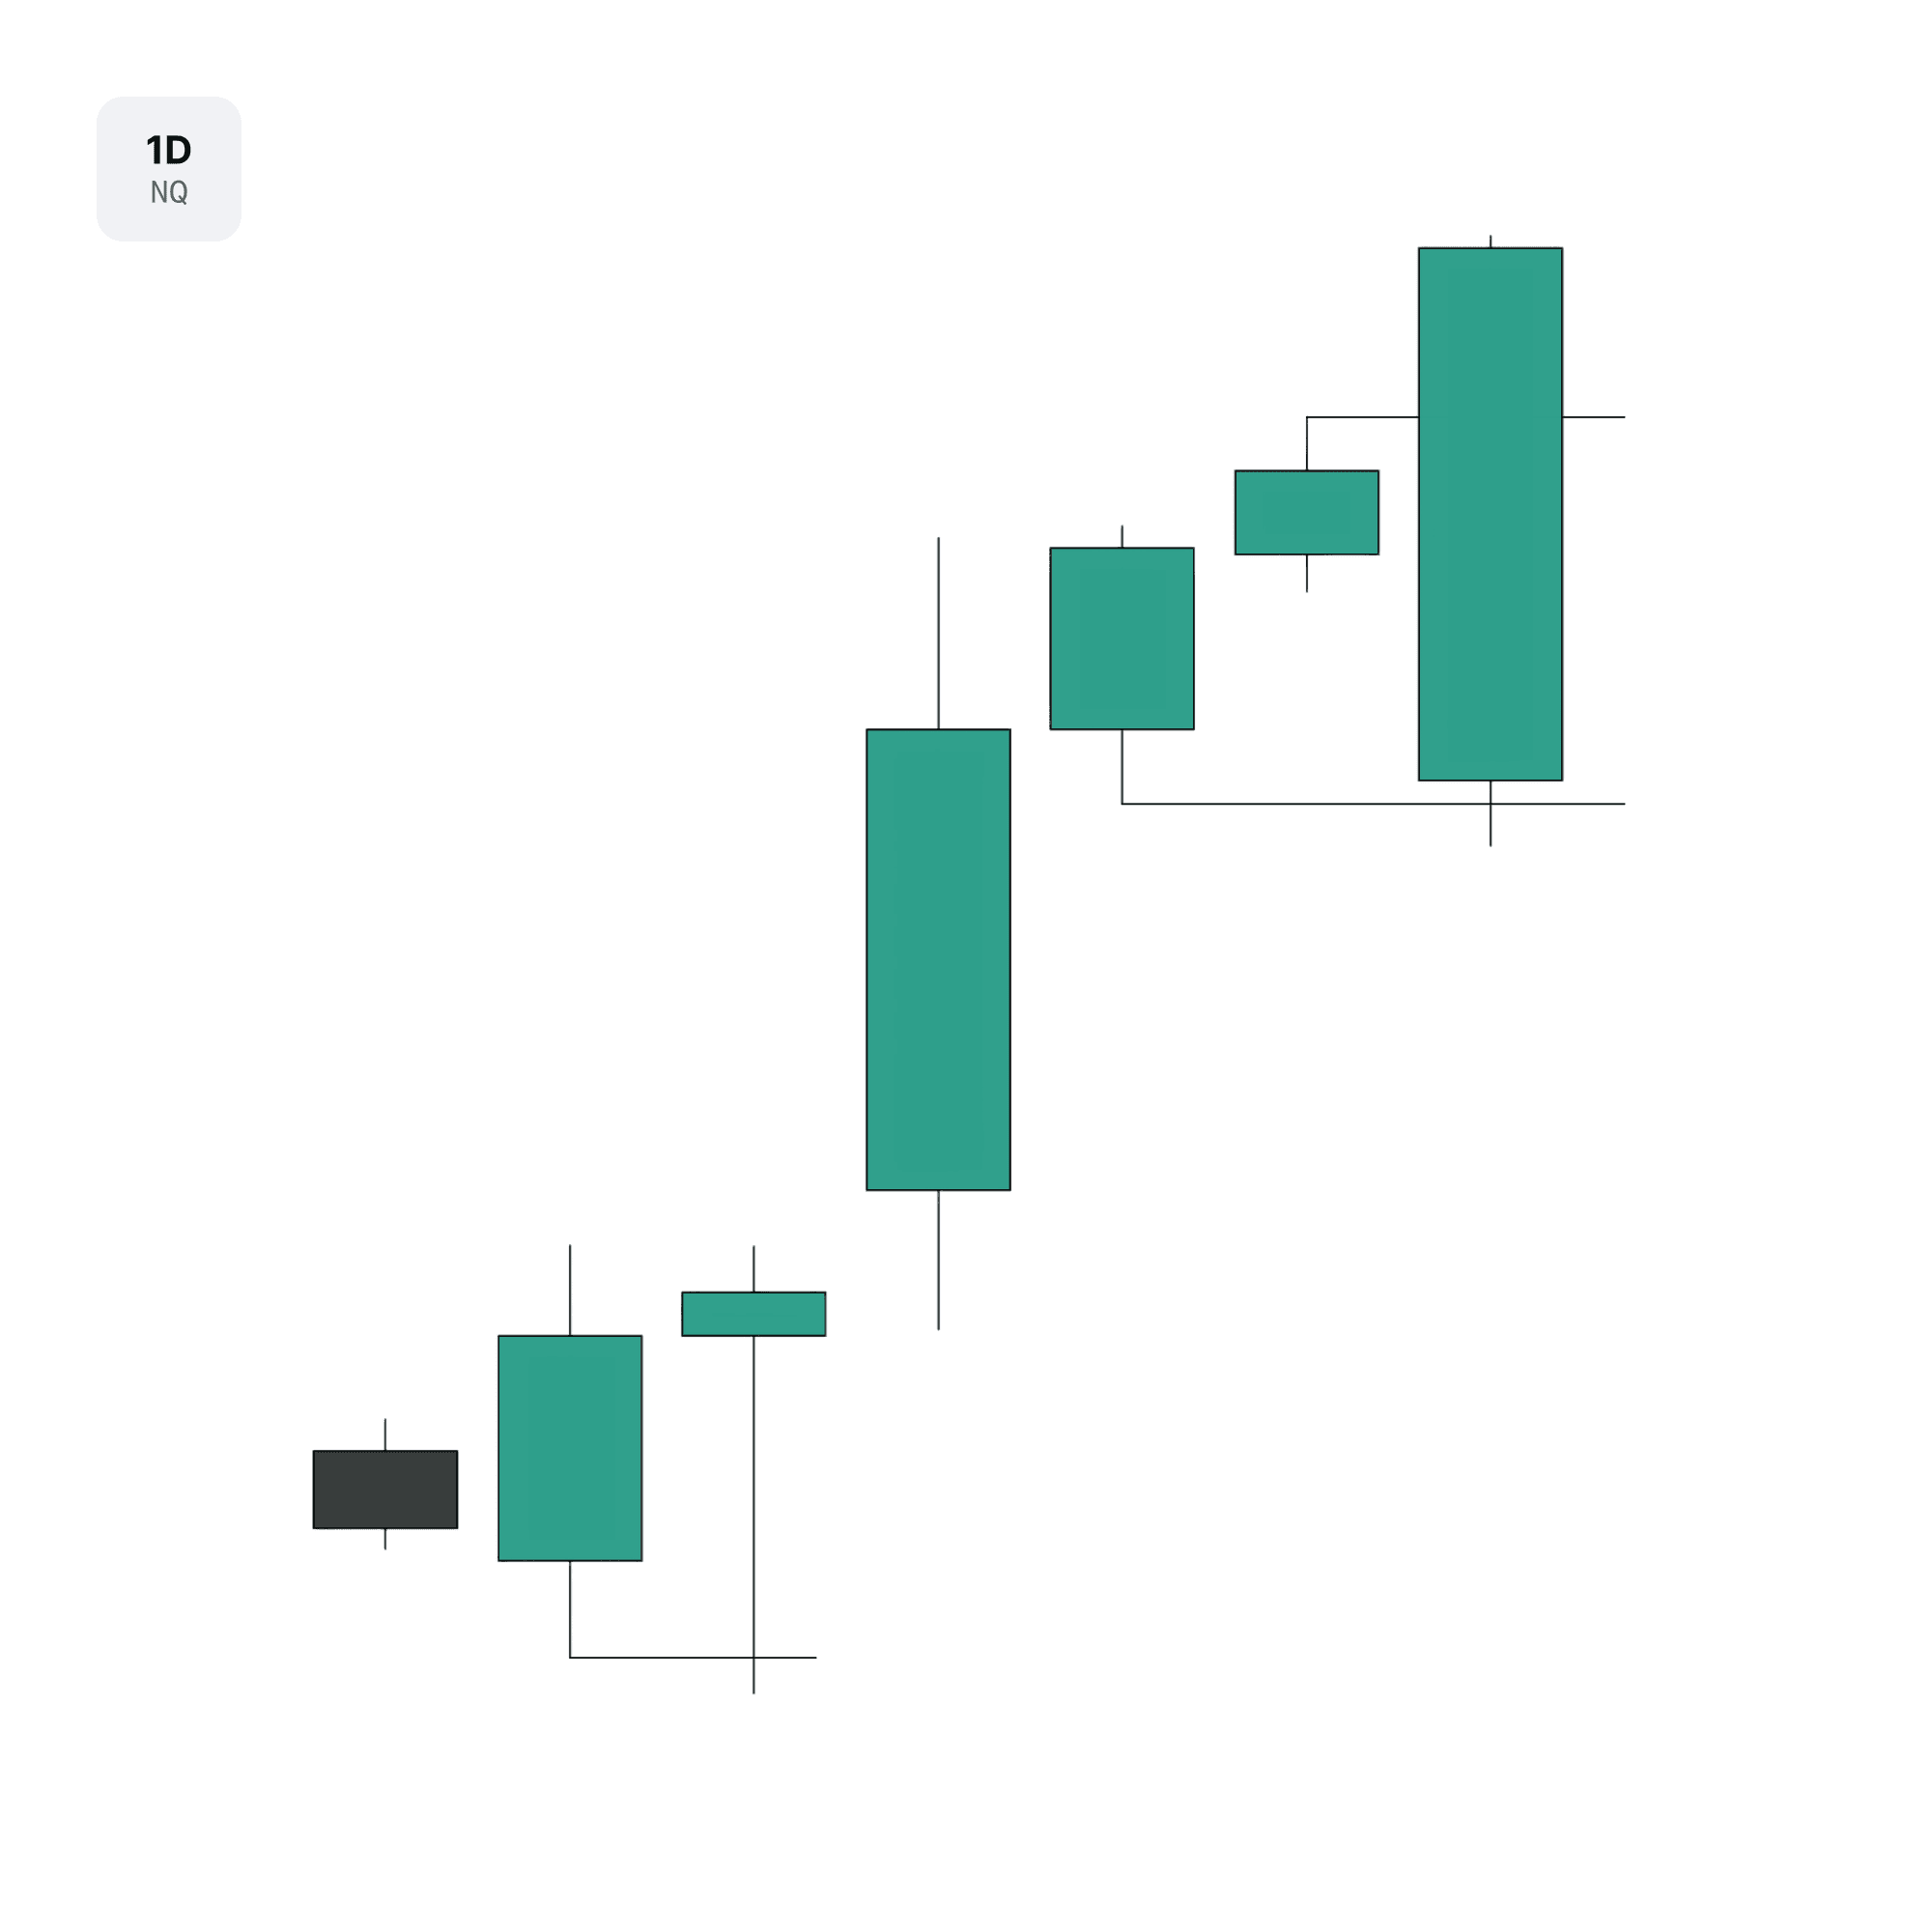
Price gapped down upon the new week open around a relevant low. The development shows a manipulation reaction with an opposing target at the highs to reach into for the New York session. This is an ideal reversal day to trade as there is a small wick on the daily candle which supports expansion. These are reversal conditions we want to participate in versus a large wick reversal day which has reduced probability for a sustained and directional expansion move.
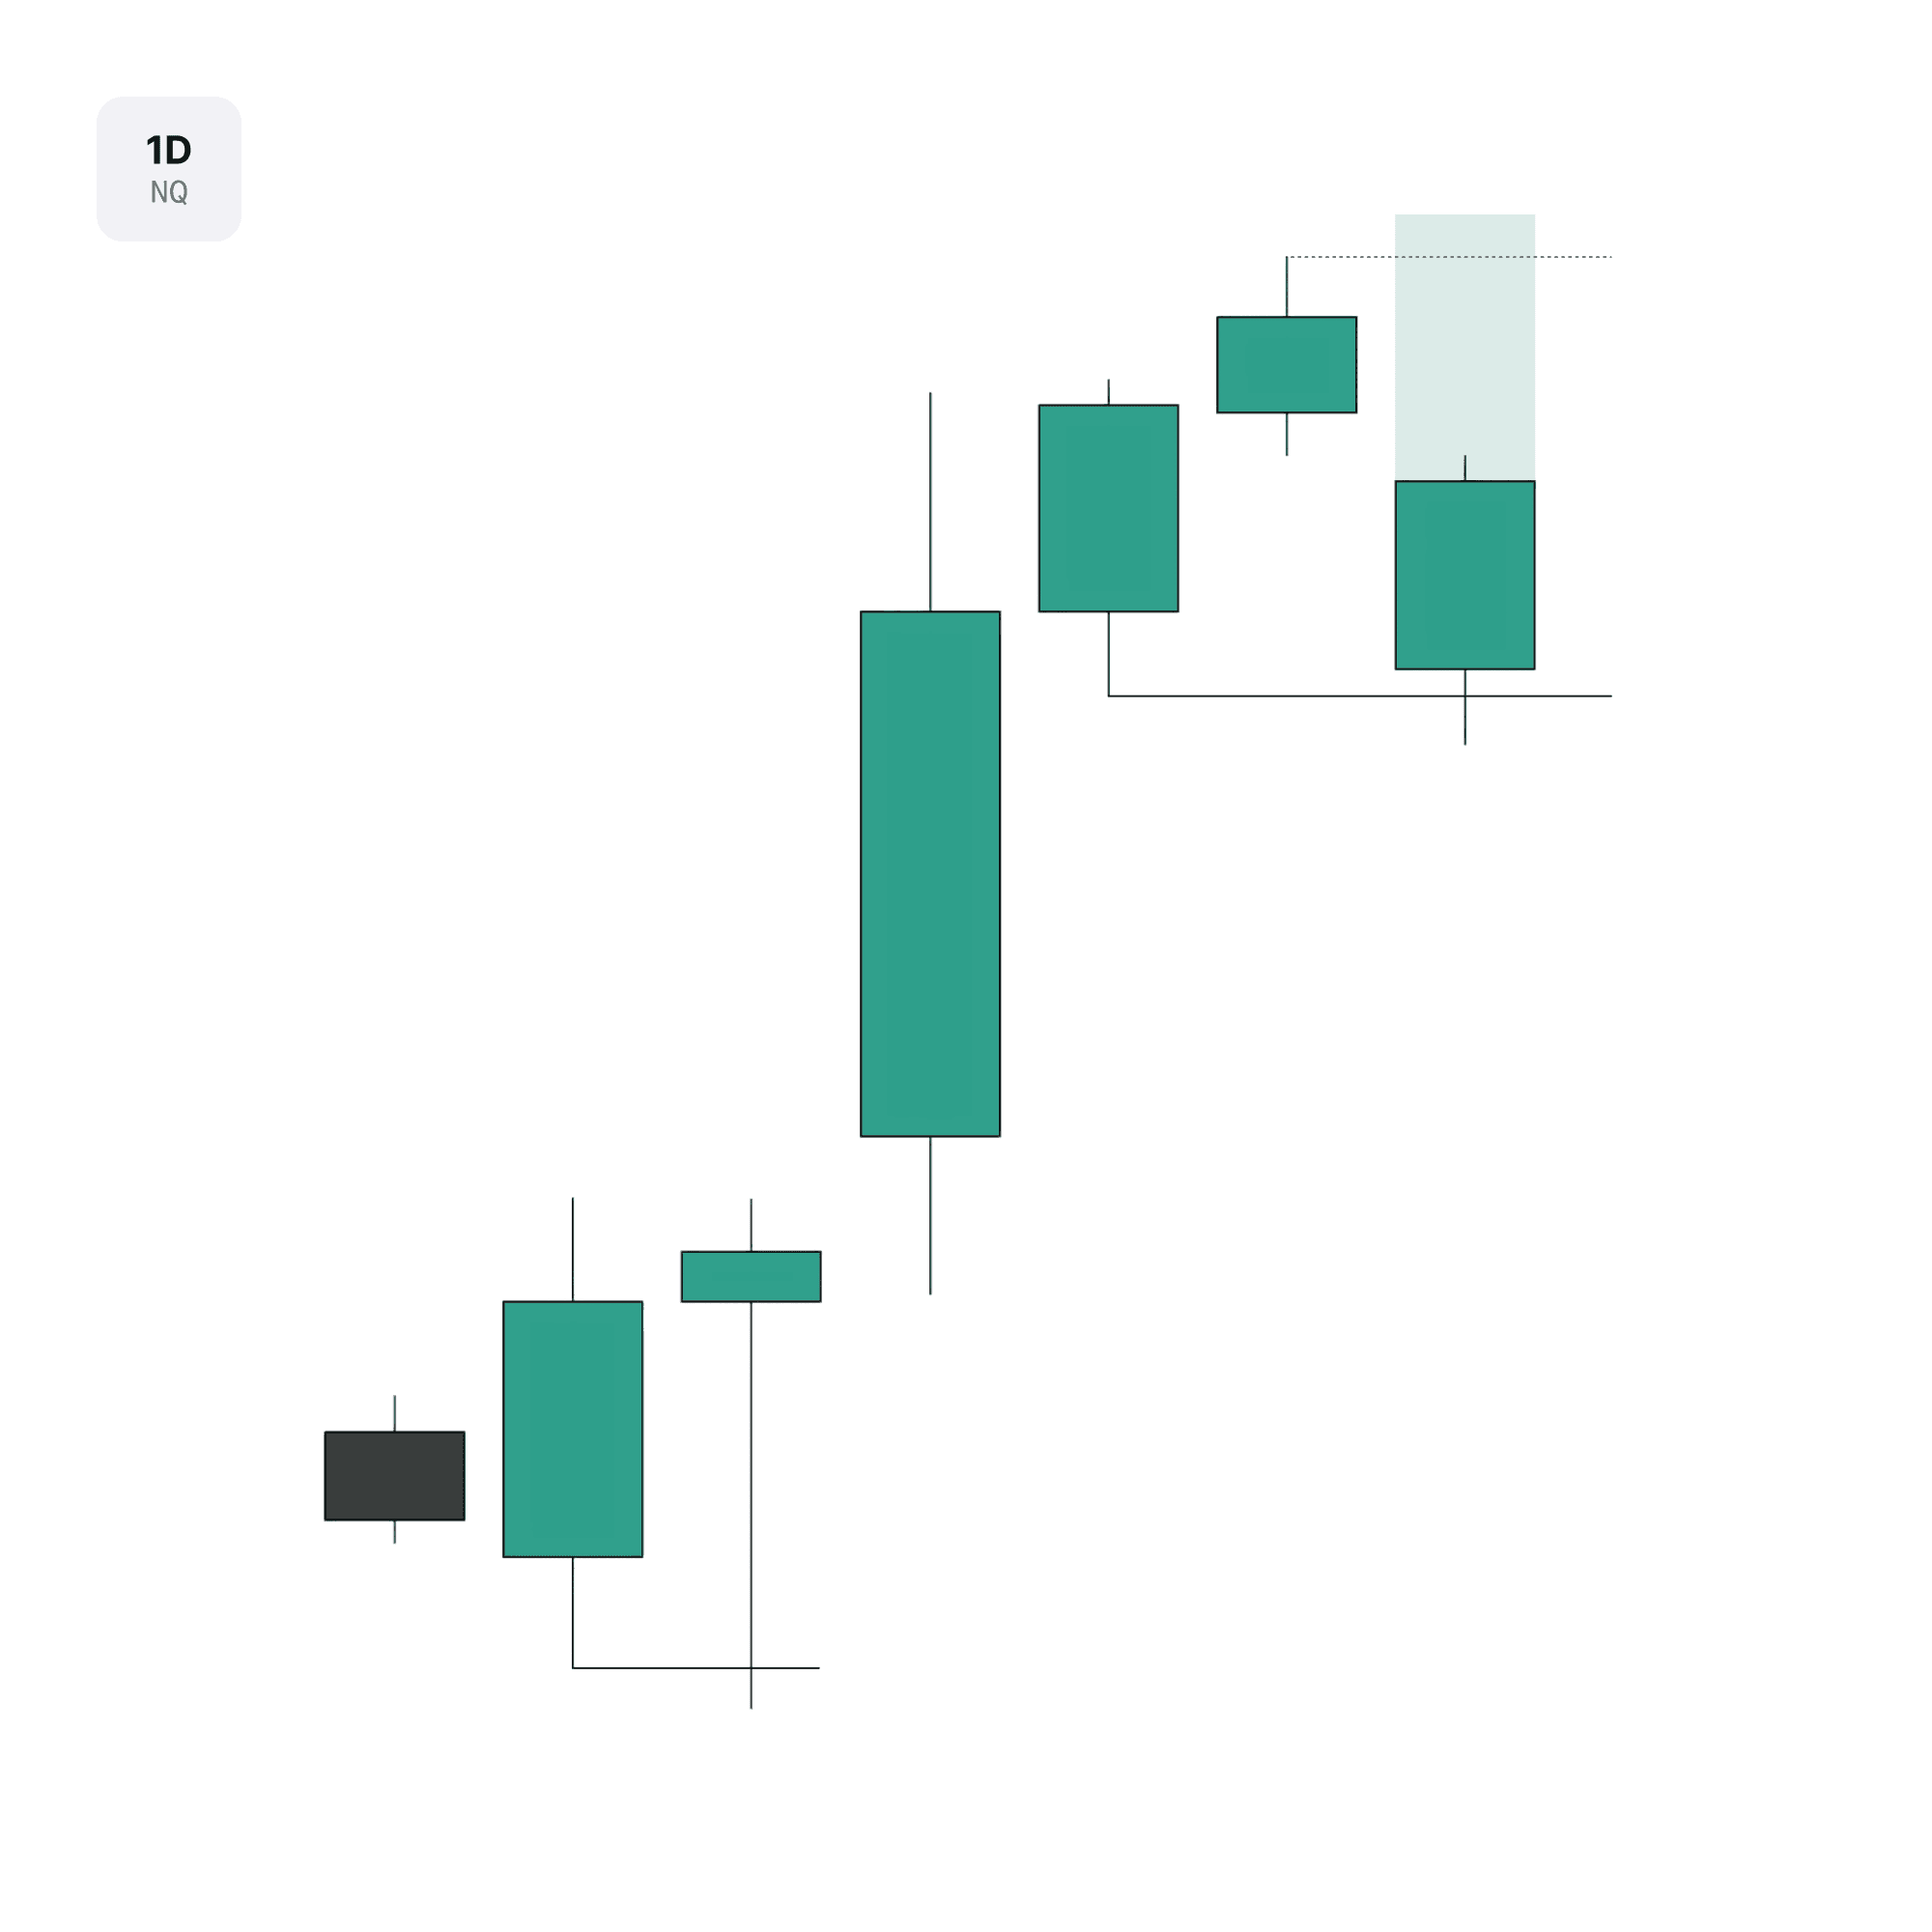
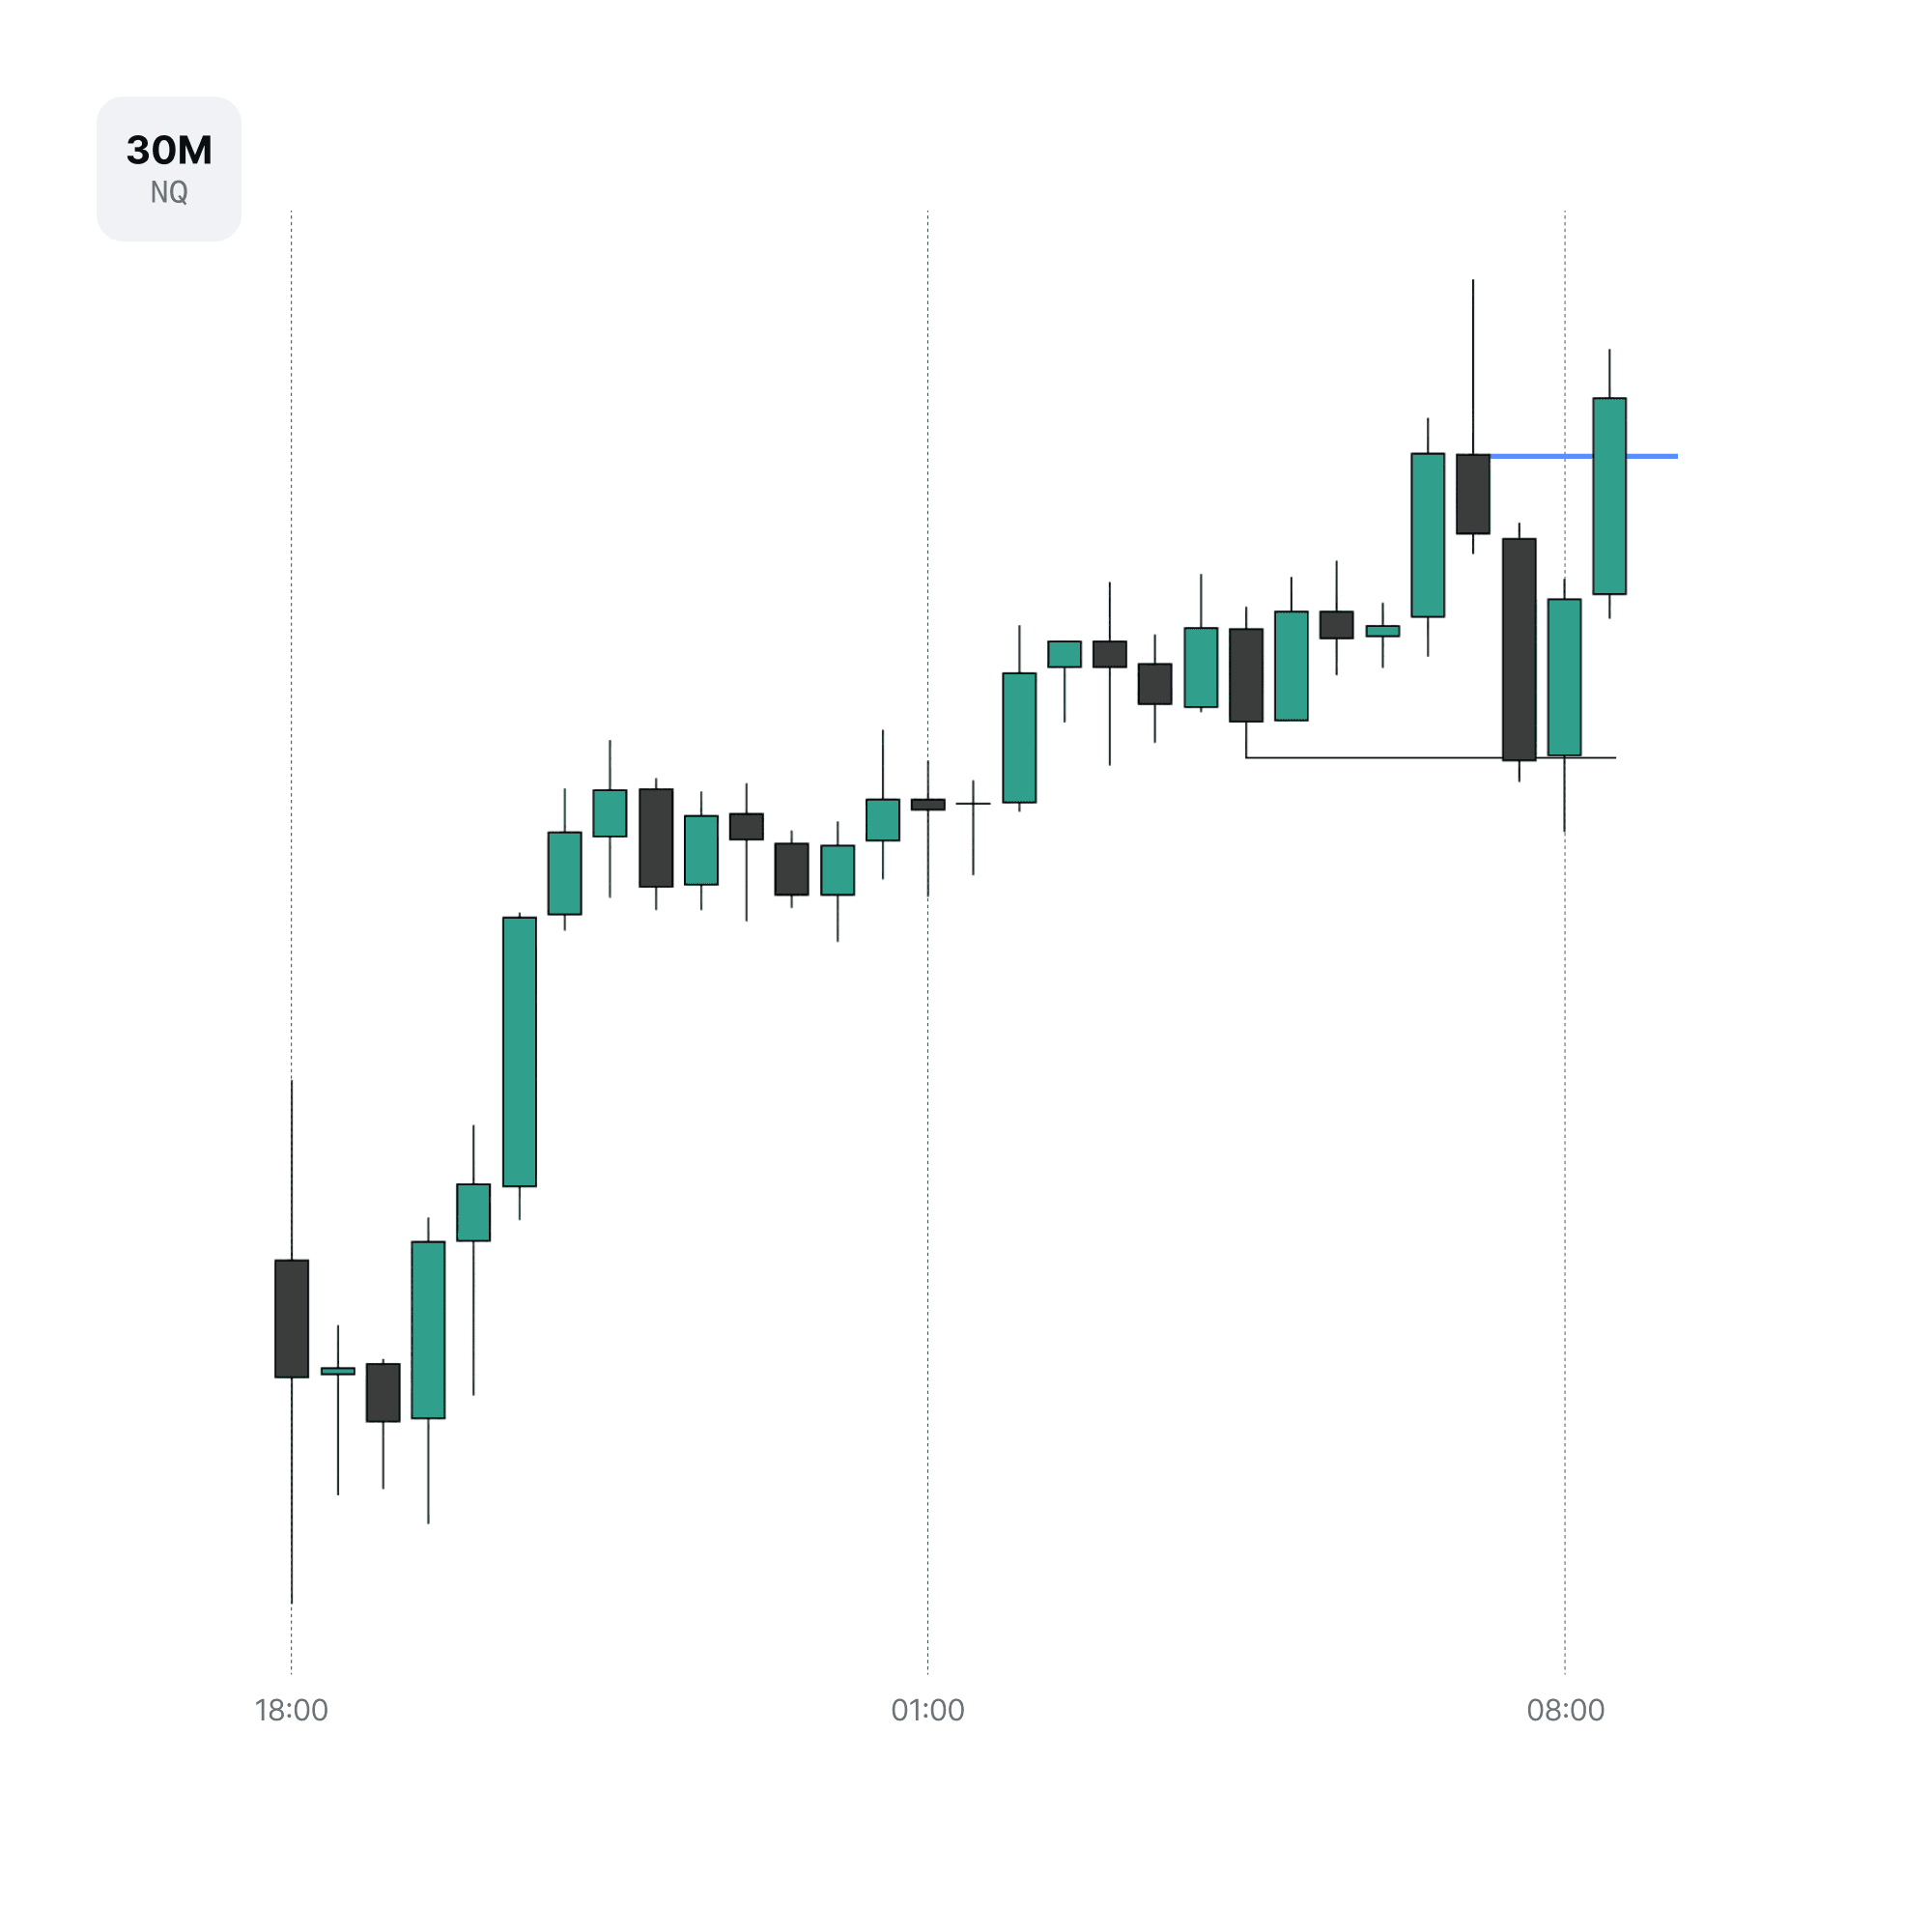
With the daily candle already holding an expectation to expand to the opposing relevant high above as the target, the next step is to align the daily profile. This is a bullish 18:00 reversal profile as the 18:00 candle manipulated the daily relevant low and the 01:00 candle held away. We assume the 08:00 candle is already in the continuation for the day.
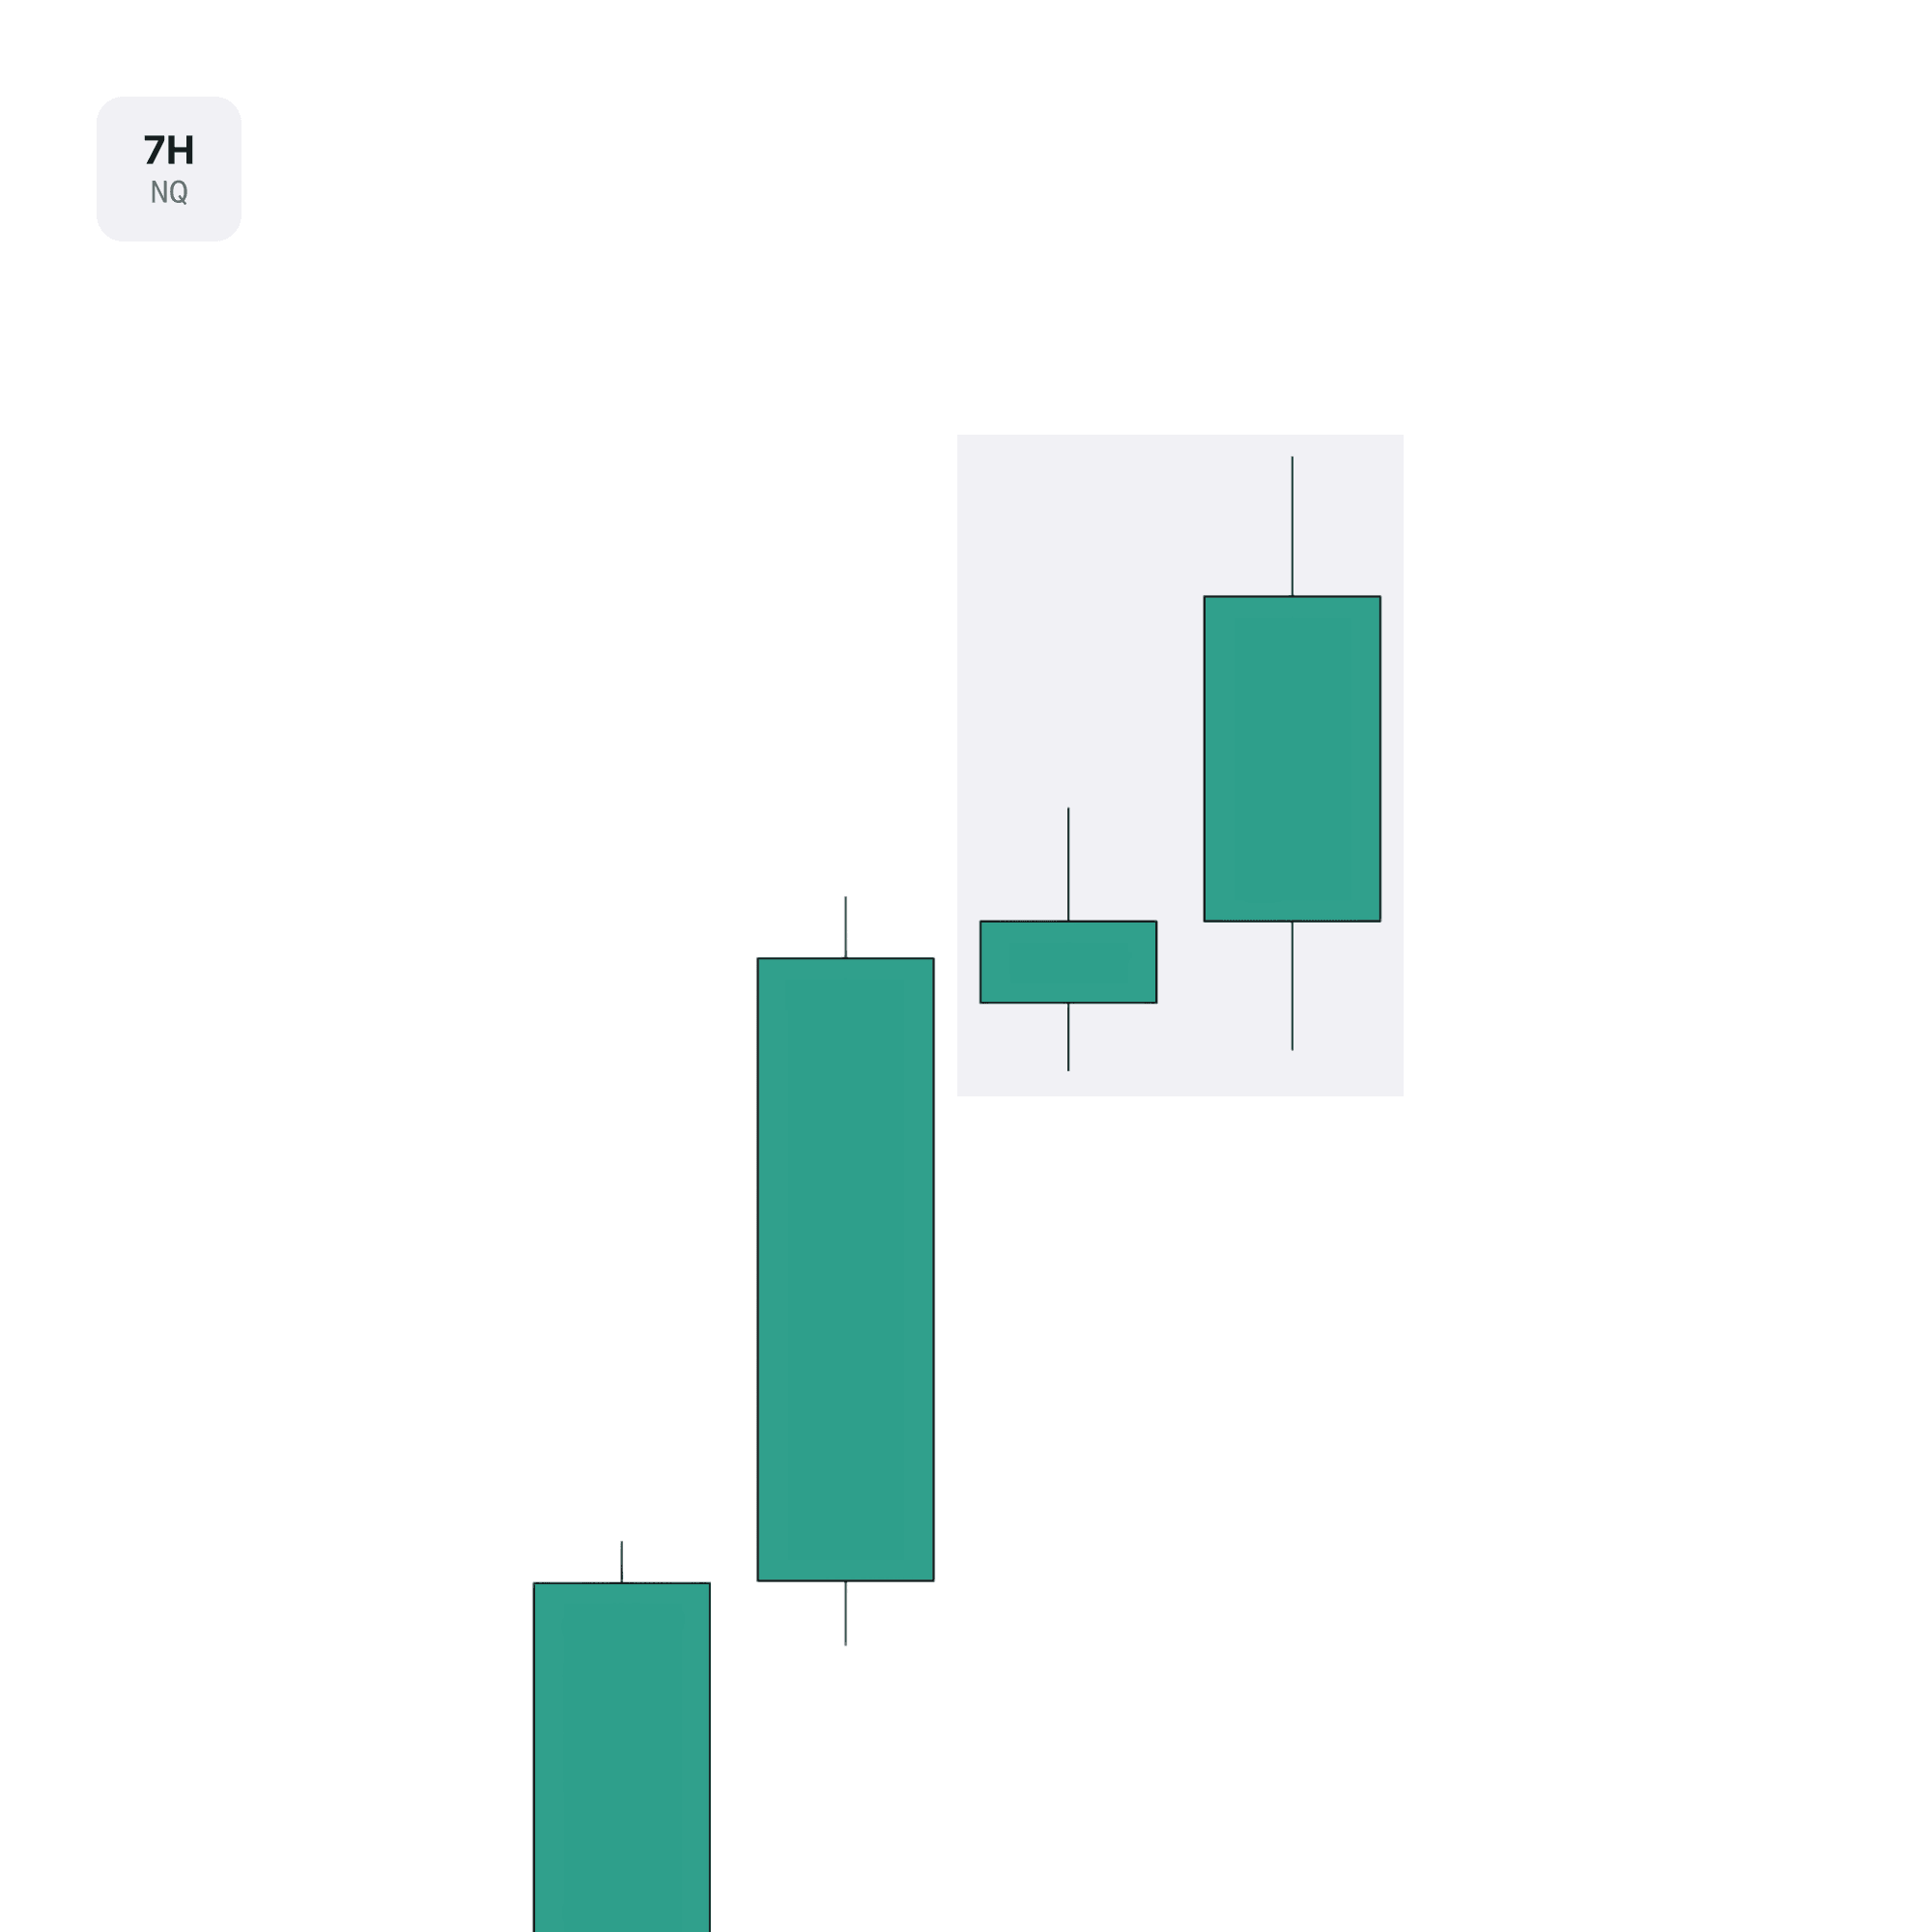
The upper wick on the 01:00 candle is providing information that is important to framing the low of the 08:00 candle. That wick will be downclose candles on an intermediate timeframe and once closed through will be respected in the continuation.
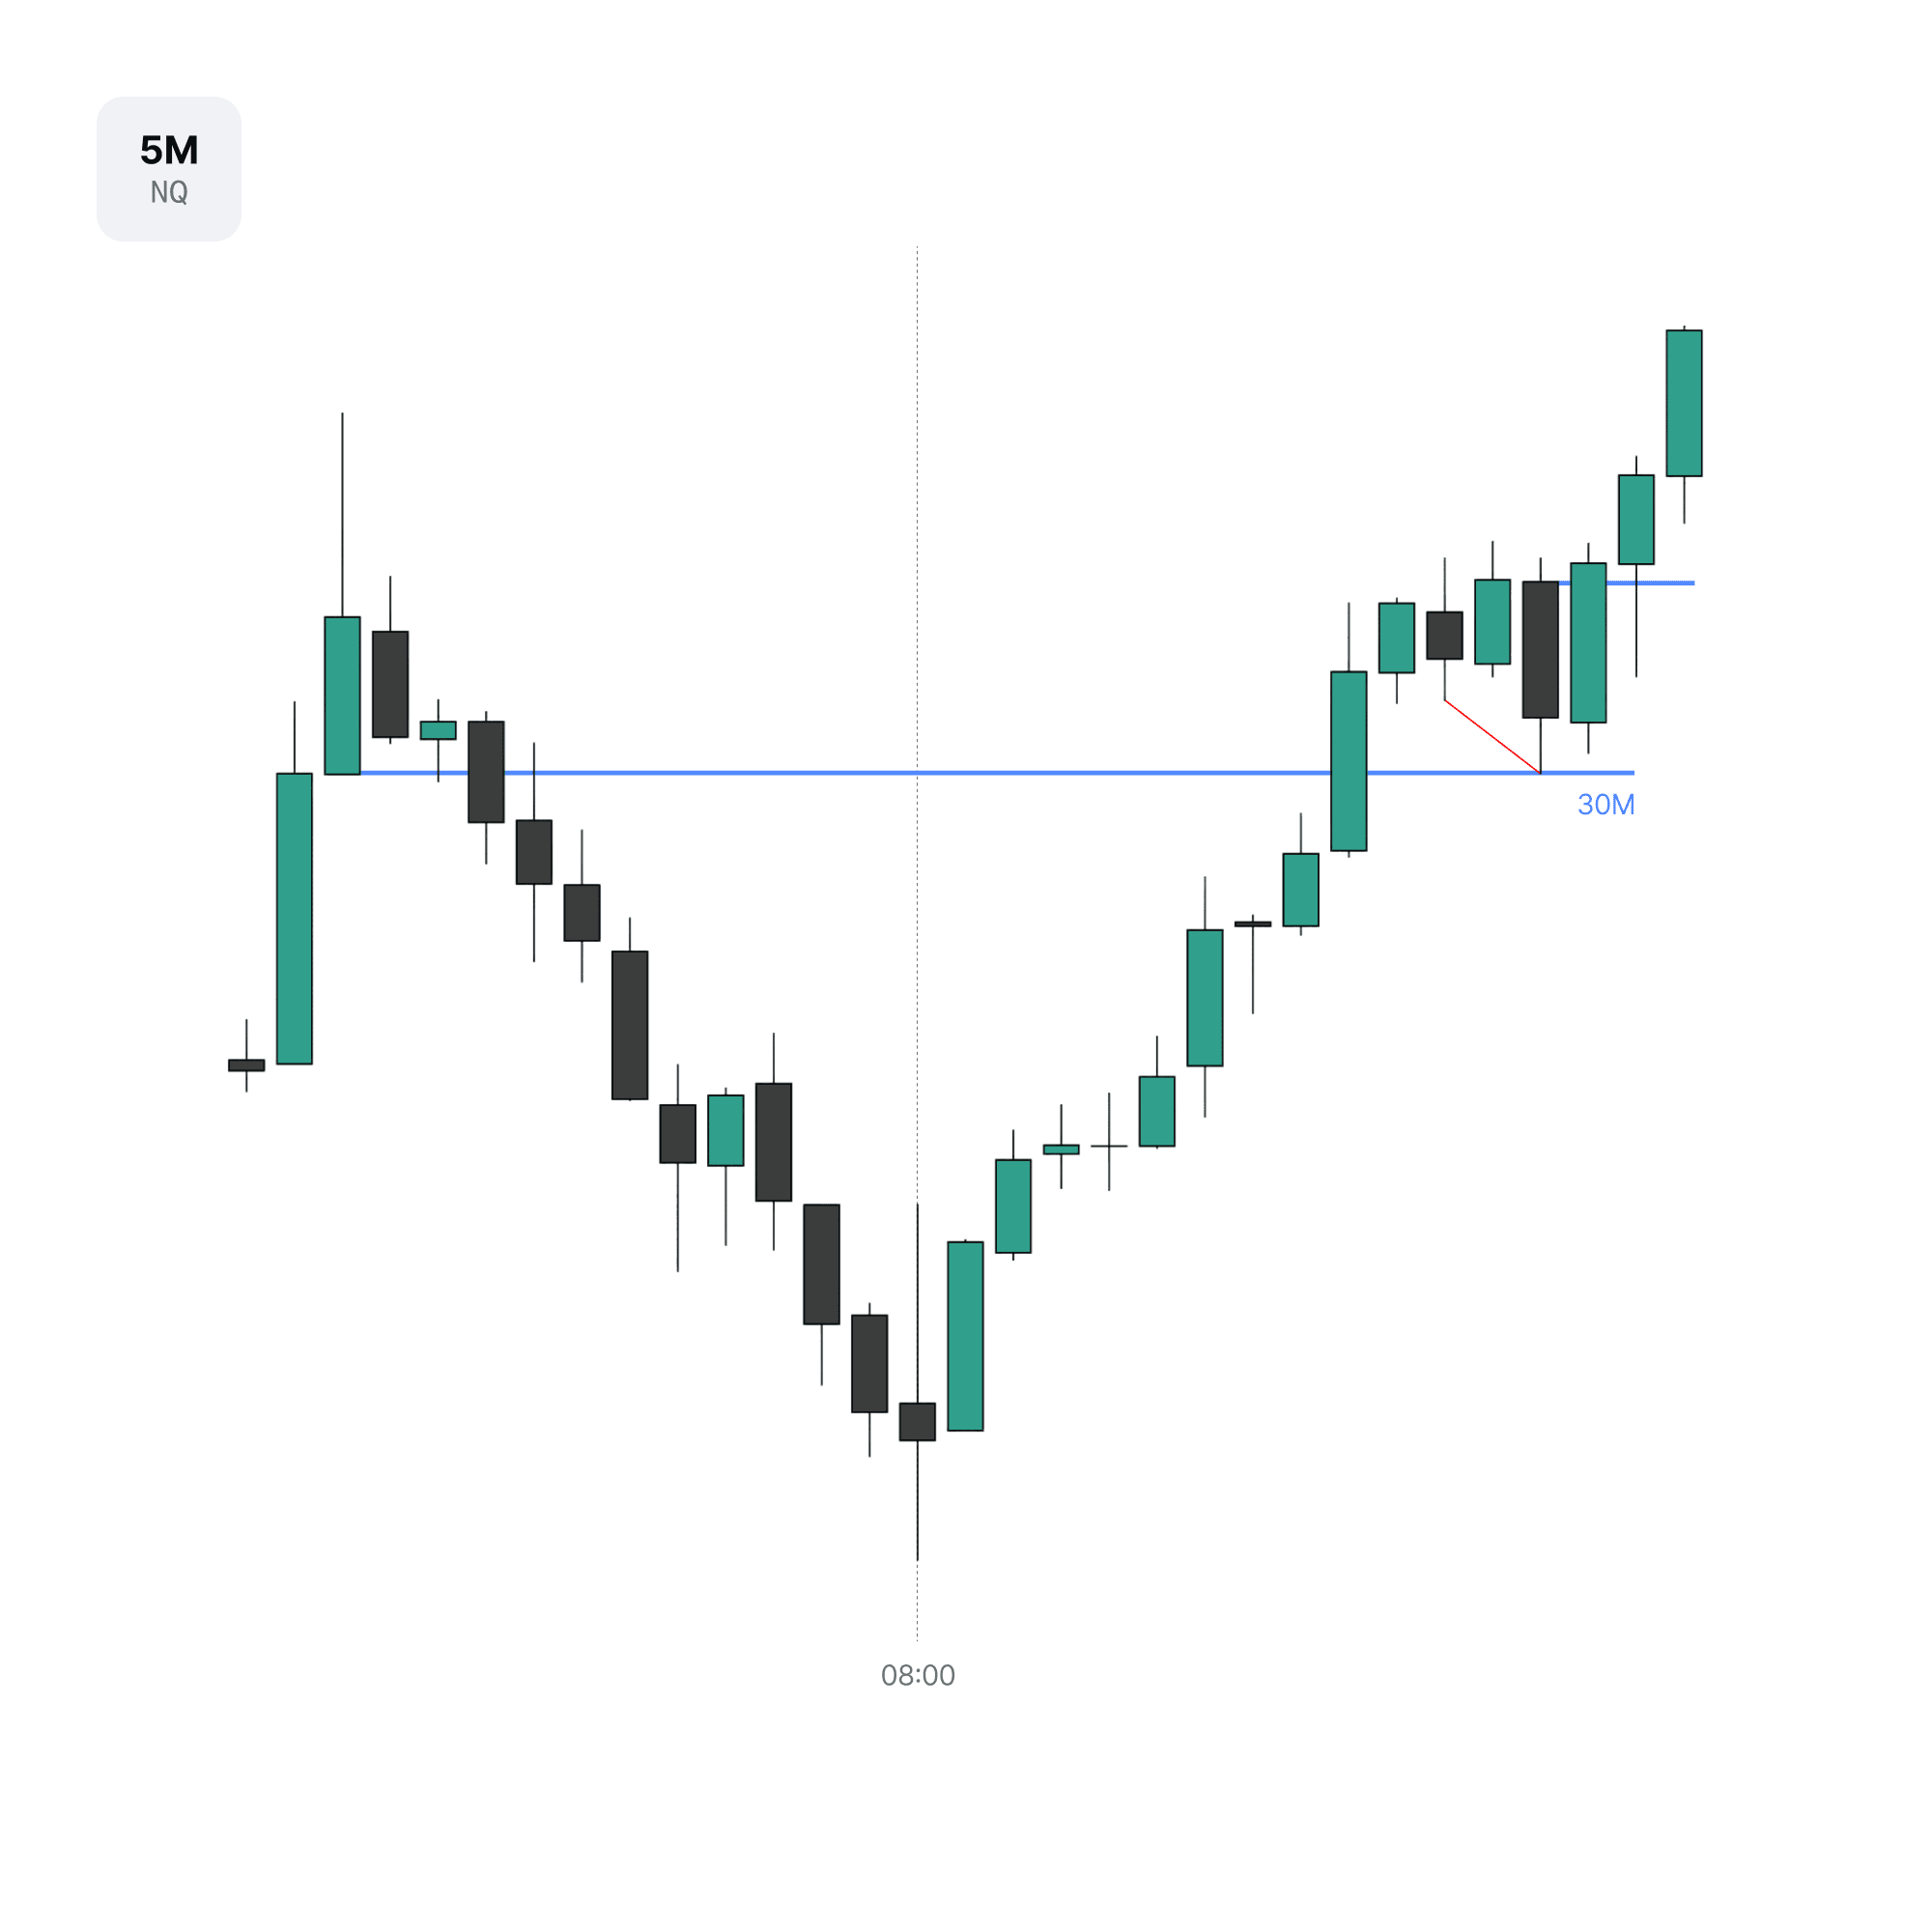
Inside of that same highlighted range of the upper wick, the downclose candles can be viewed on the 30m timeframe. The closure above confirms the low of the 08:00 candle that we will look to trade away from inside of this day. This is the framework of the daily profile that will be entered alongside of.
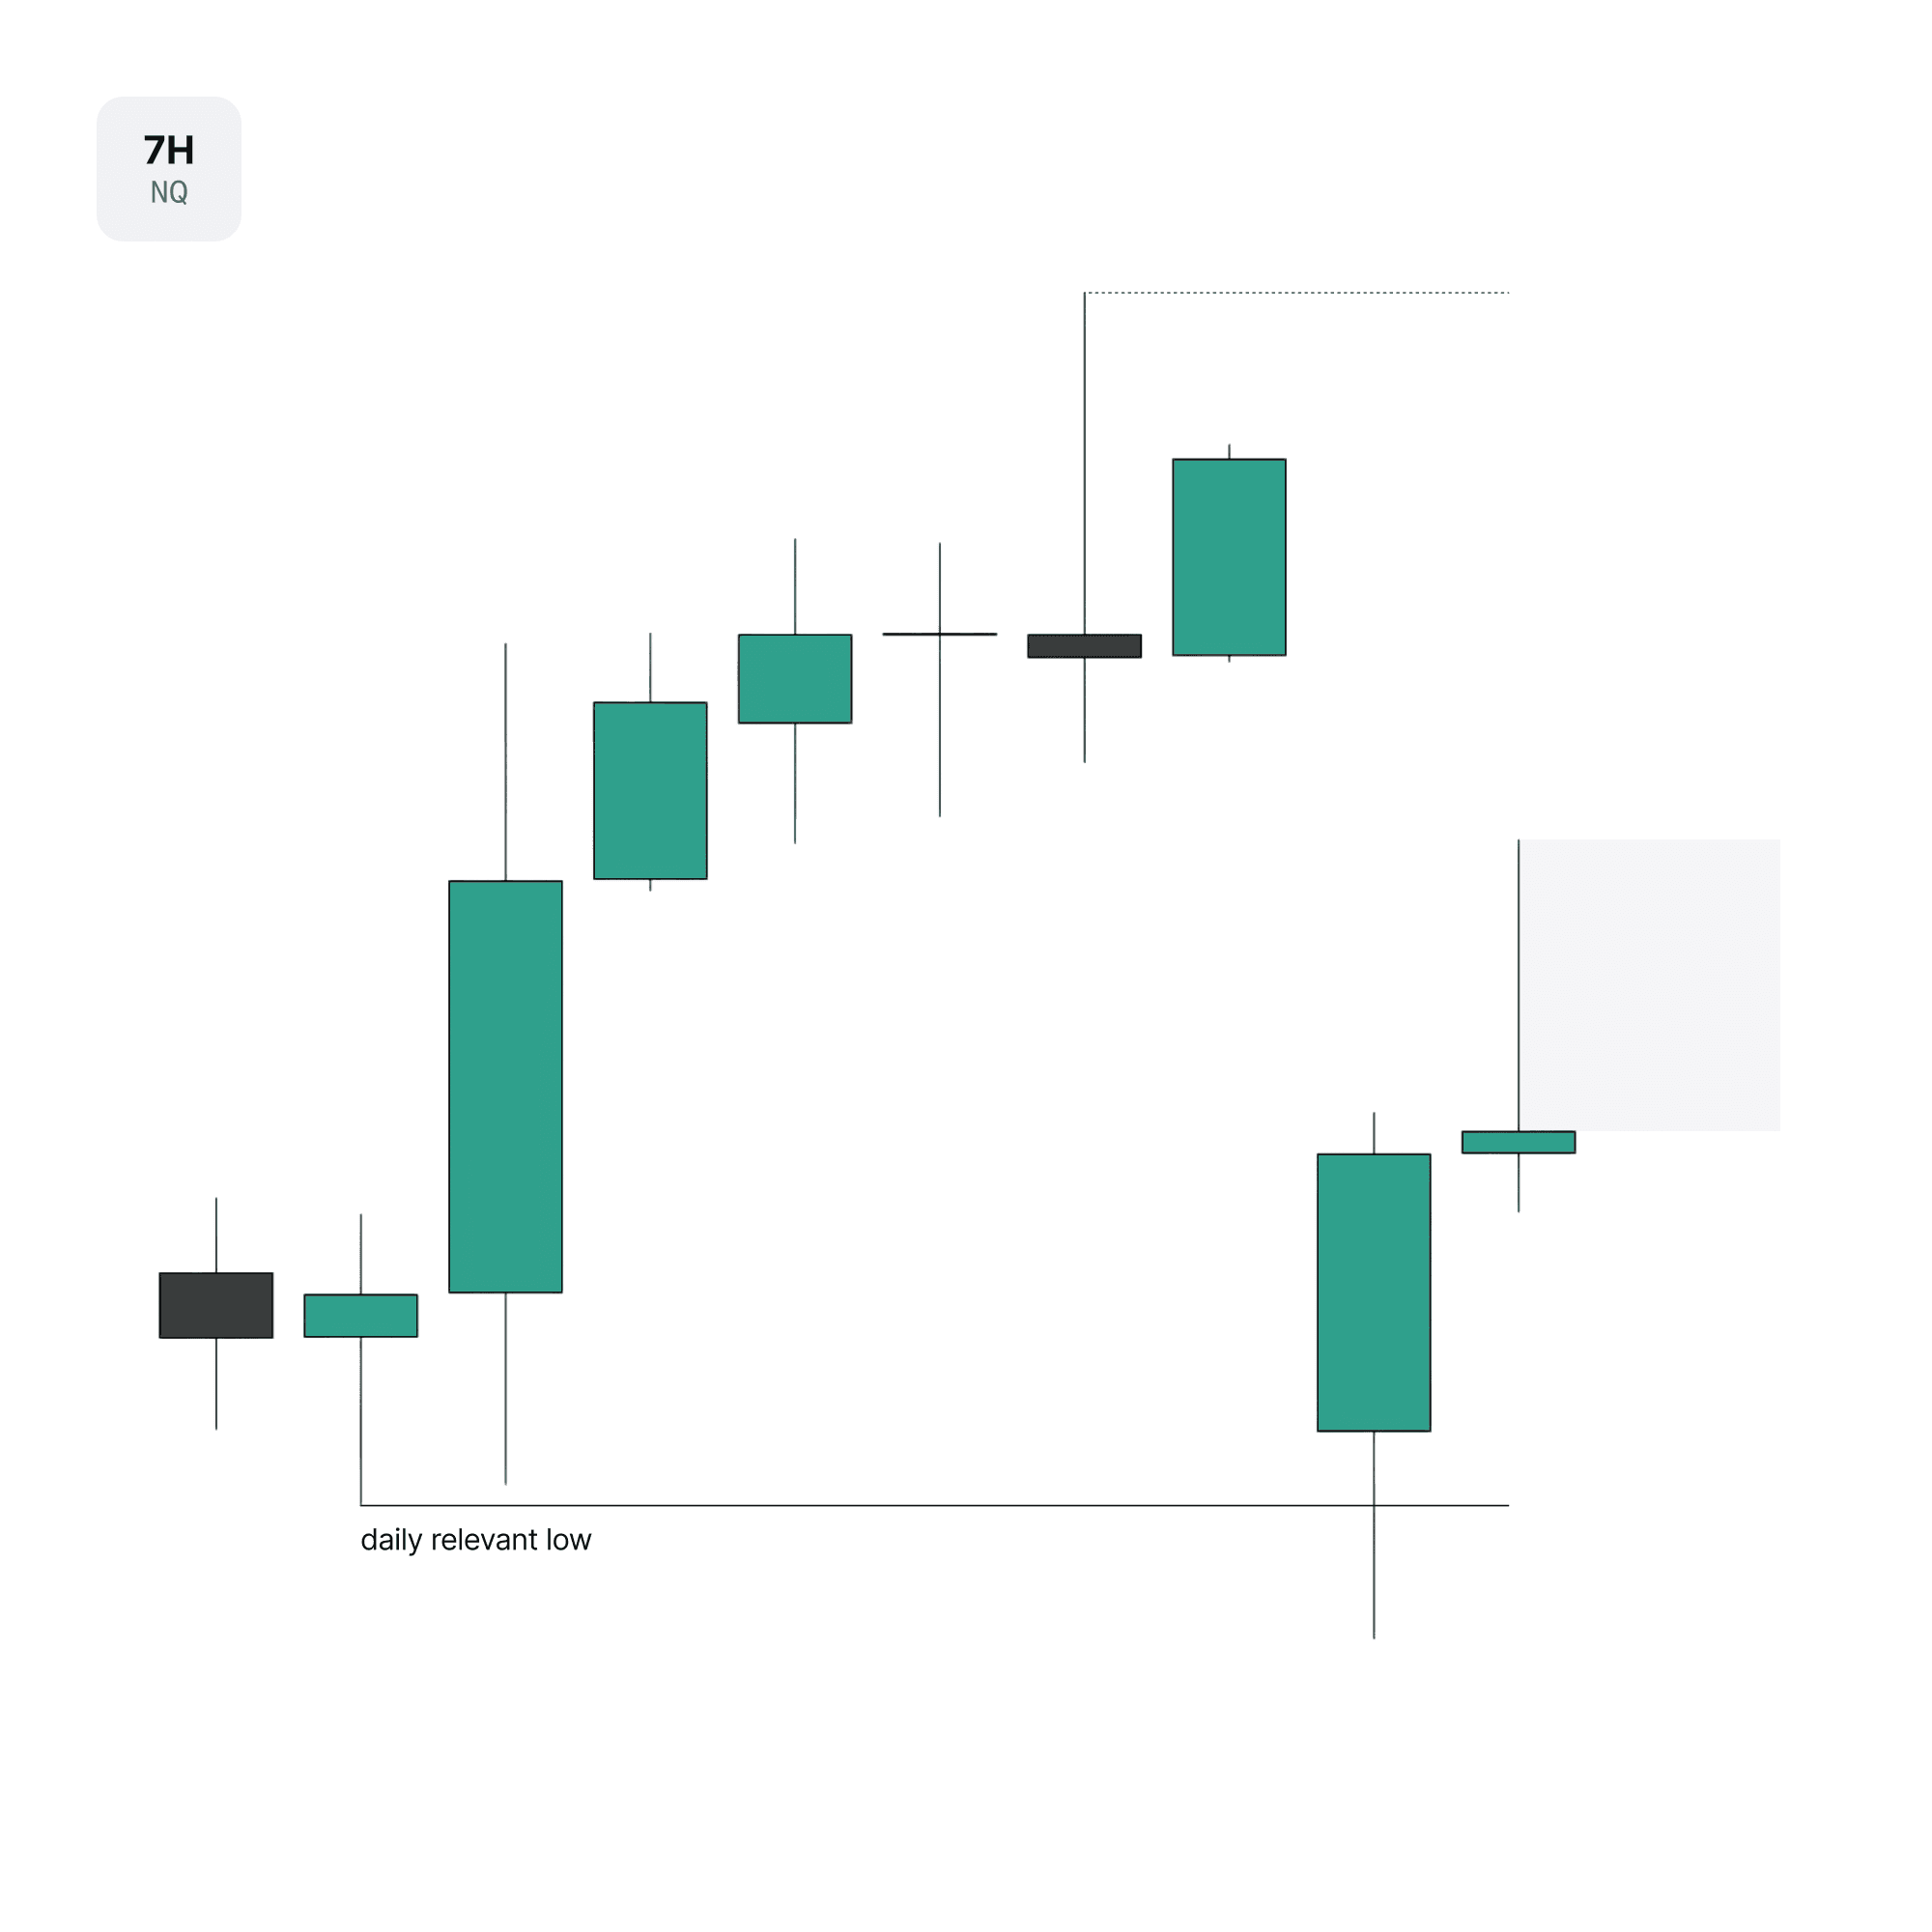
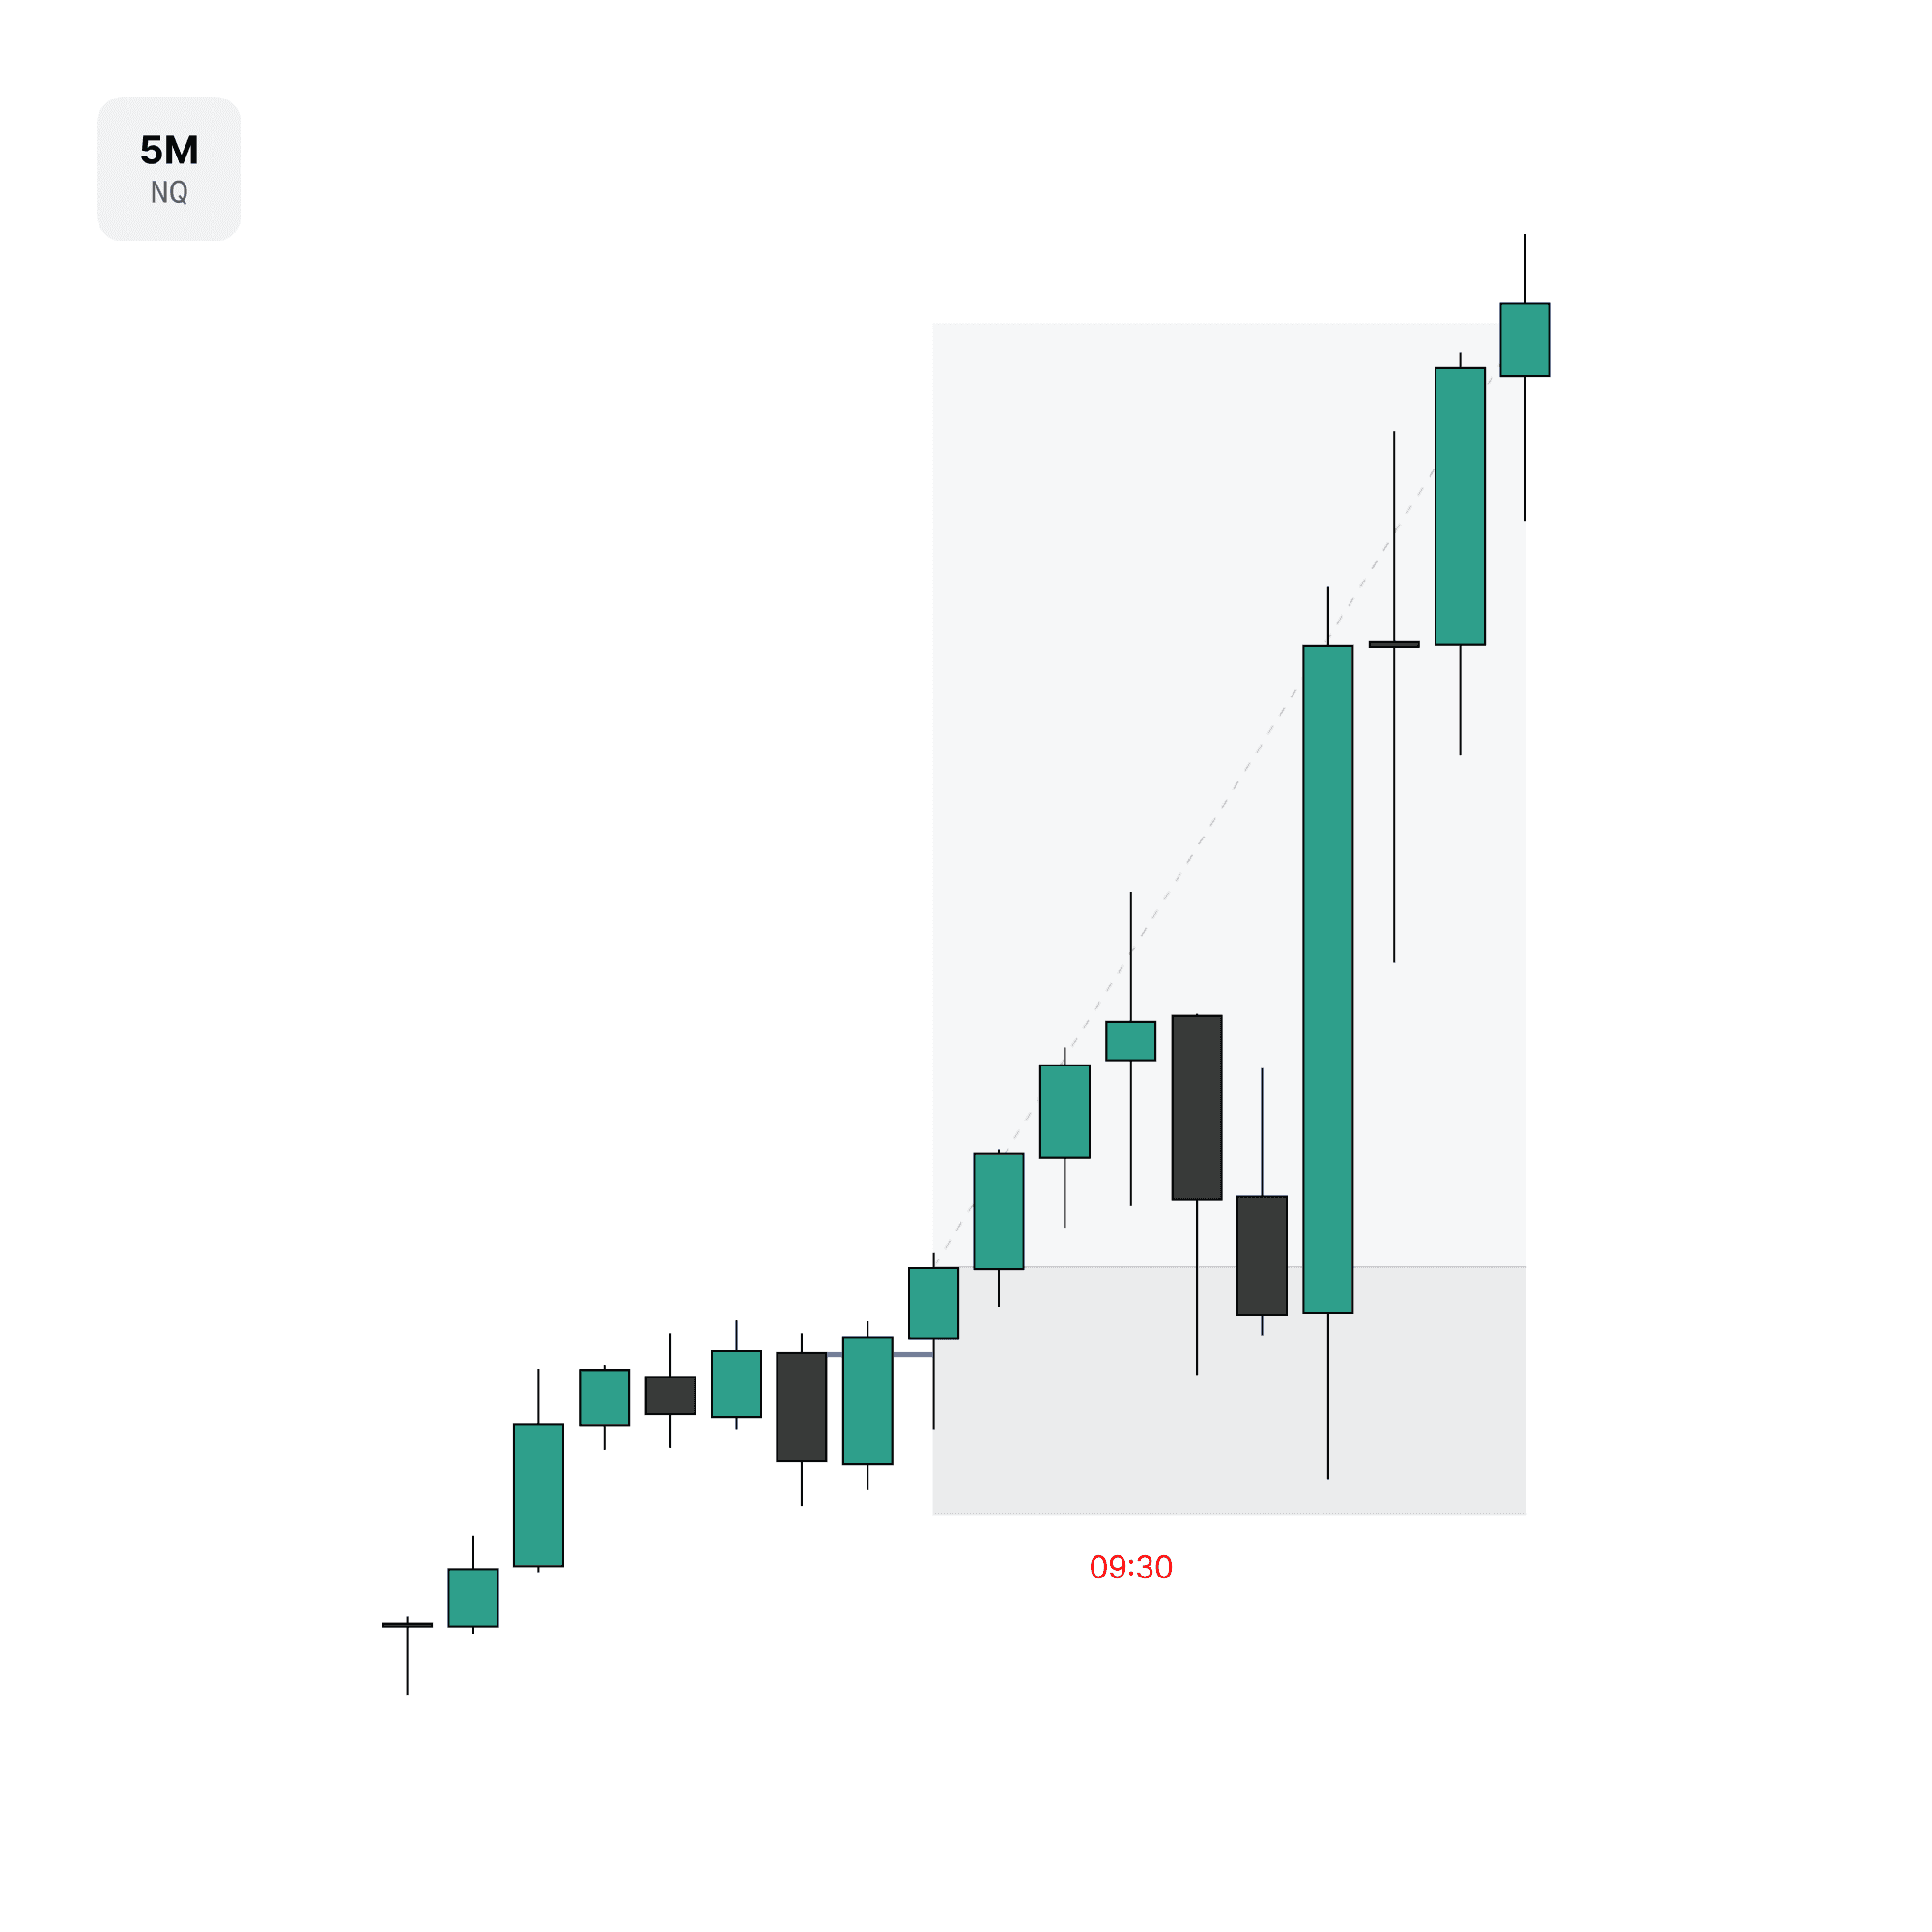
The entry signature in the continuation is provided after retesting and respecting to the 30m downclose candles from the previous image. Paired with a divergence for confluence, the new closure through the refined signature is where the trade is placed to get onside with the assumed move higher for the New York session.
Allowing the trade to play out, the 9:30 open expands price higher to the objective while respecting the stop loss on the invalidation point of the signature. This is a prime example of not micromanaging positions. When a trade is put on, before it either stops out or breaks in the direction of the idea, most management should be hands off. We do not want to step in the way of valid frameworks.
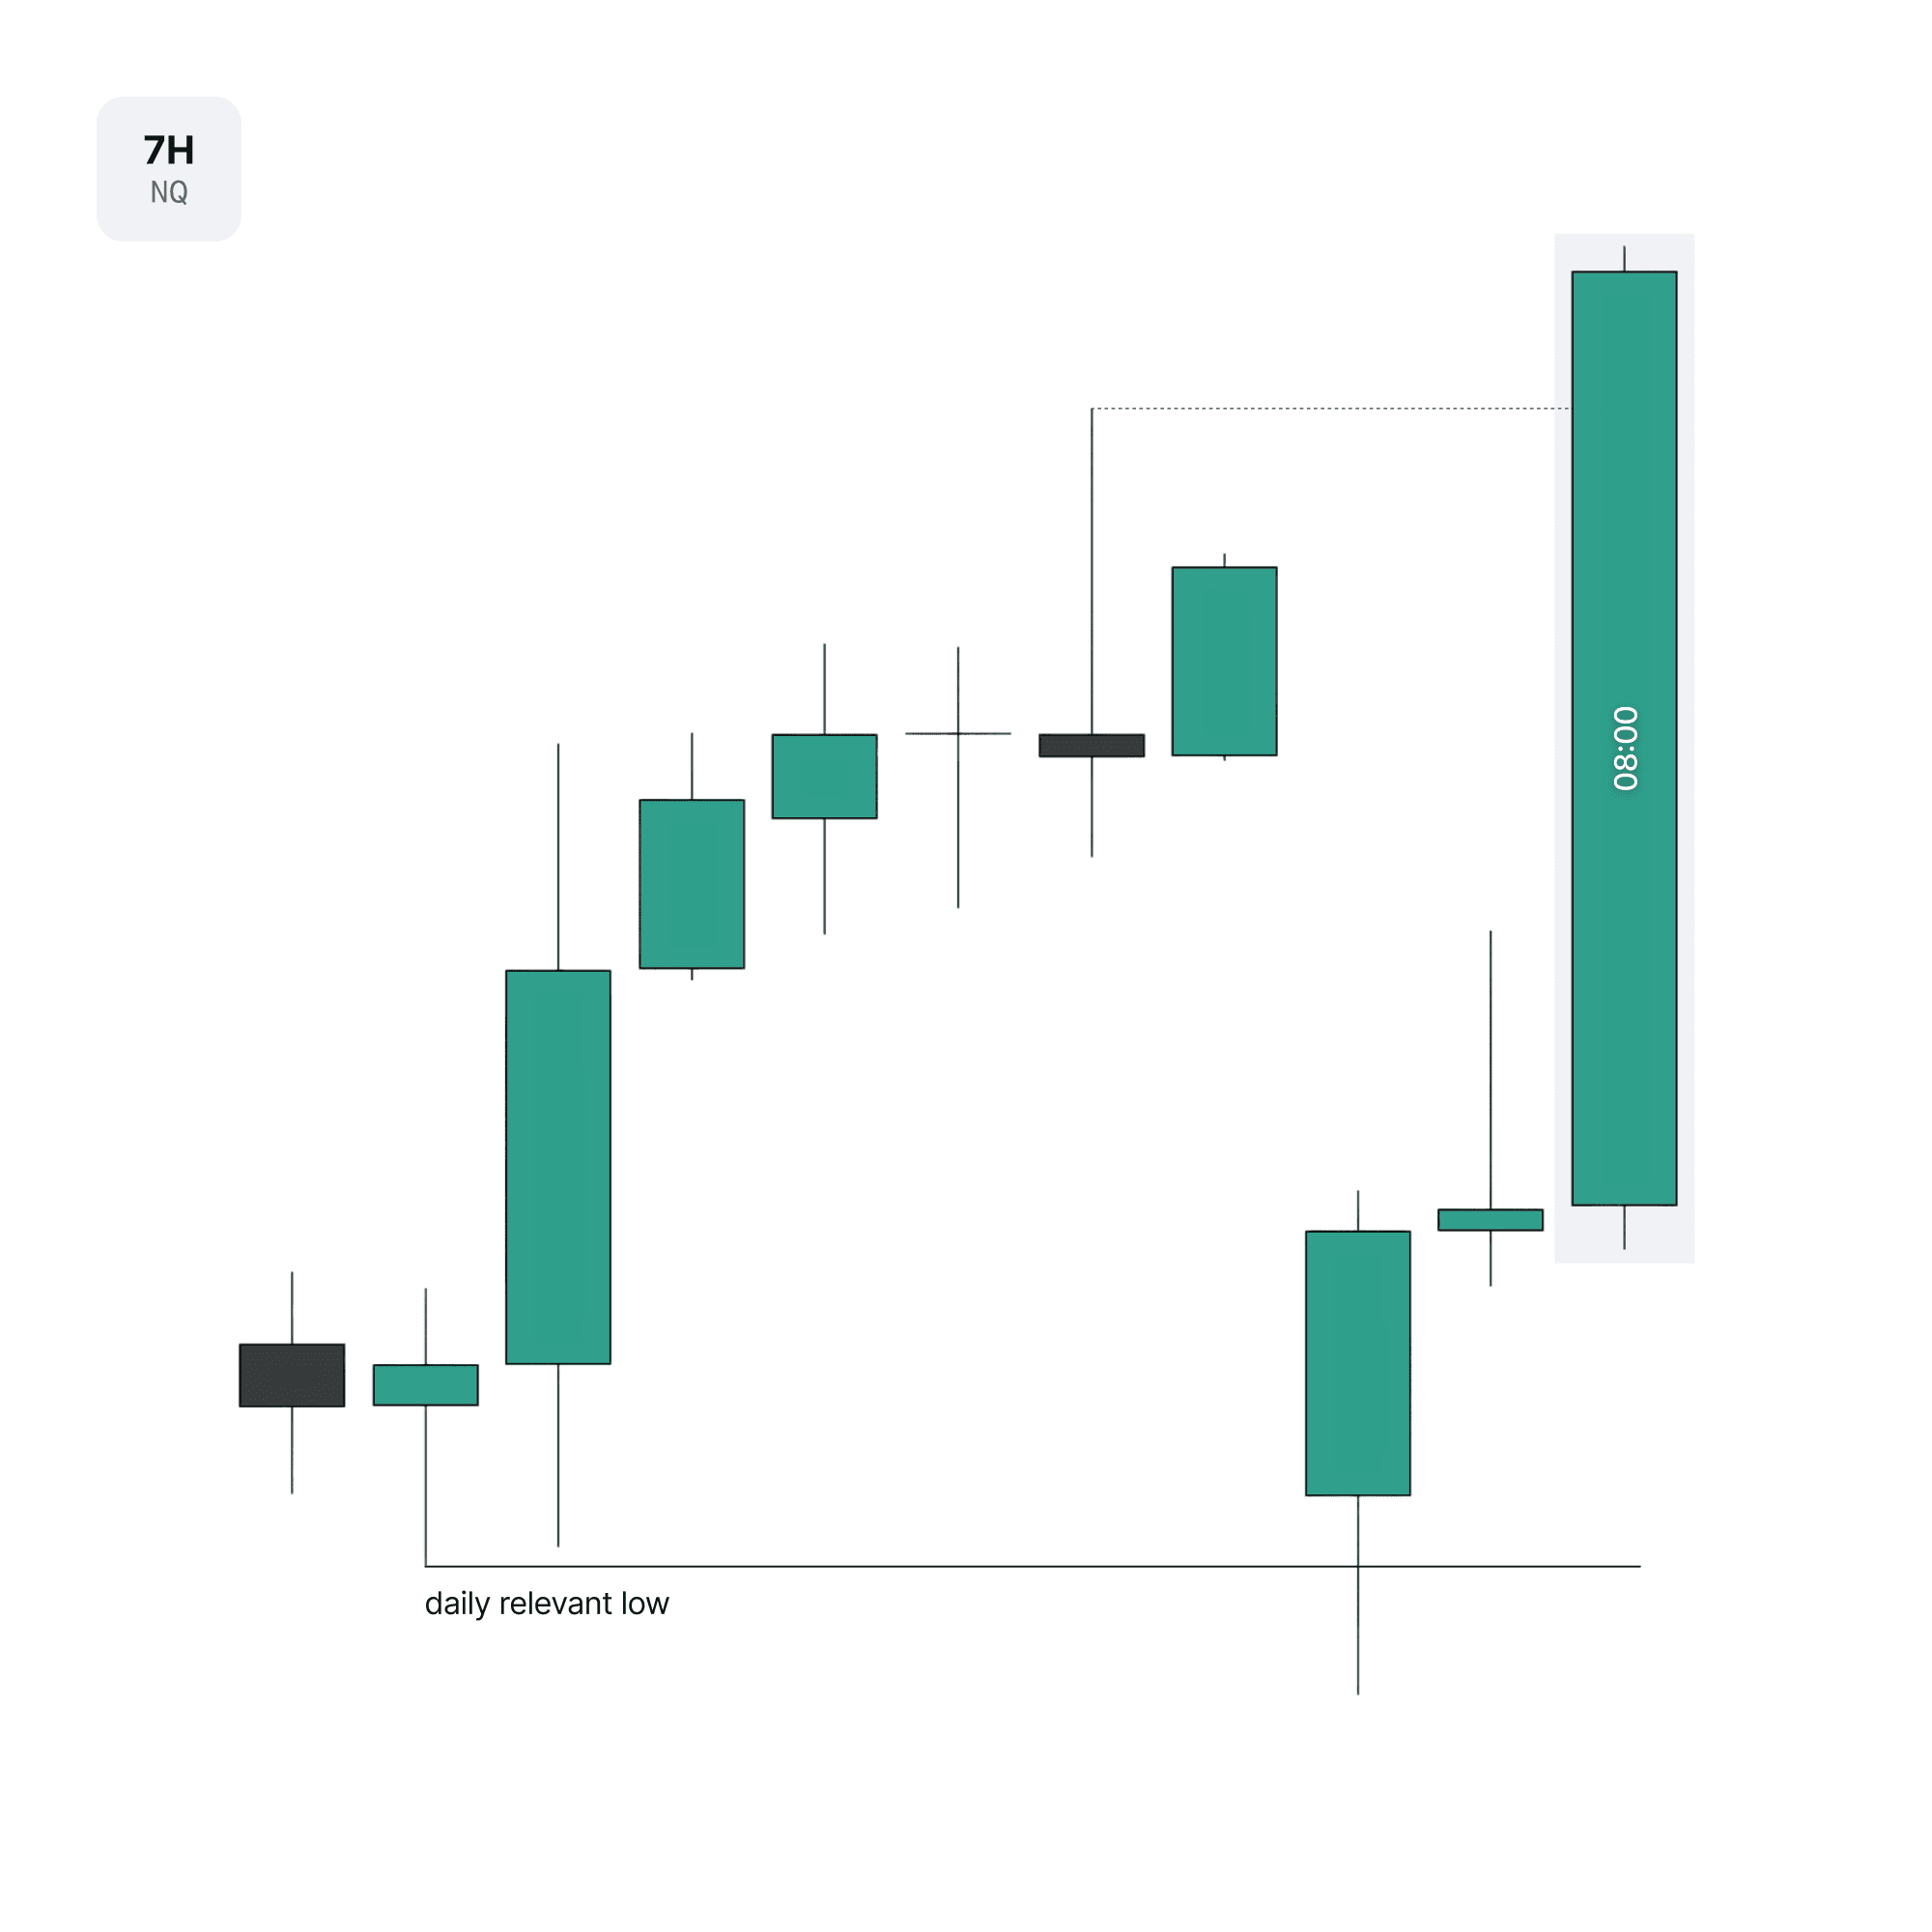
Moving back out to the 7h timeframe, you can see the logic playing out.
Framework is established off the daily with relevant swings
Daily profile alignment is confirmation and provides New York expectation
Low of the 08:00 candle is framed off the 30m downclose candles
Entry is positioned in relation to the session candle
Ideal Continuation Day Trade Breakdown
With the previous day follow through, the engagement of relevant swings on the daily suggests the next day to be a continuation higher. There is a confirmed manipulation off the lows and a breakout signature through the highs.
Allowing the 18:00 and 01:00 candle to print, the daily profile on NQ is showing a bullish 18:00 reversal profile. This is one that sets the 08:00 candle to be the continuation. However, there is more confluence that can be added to this.
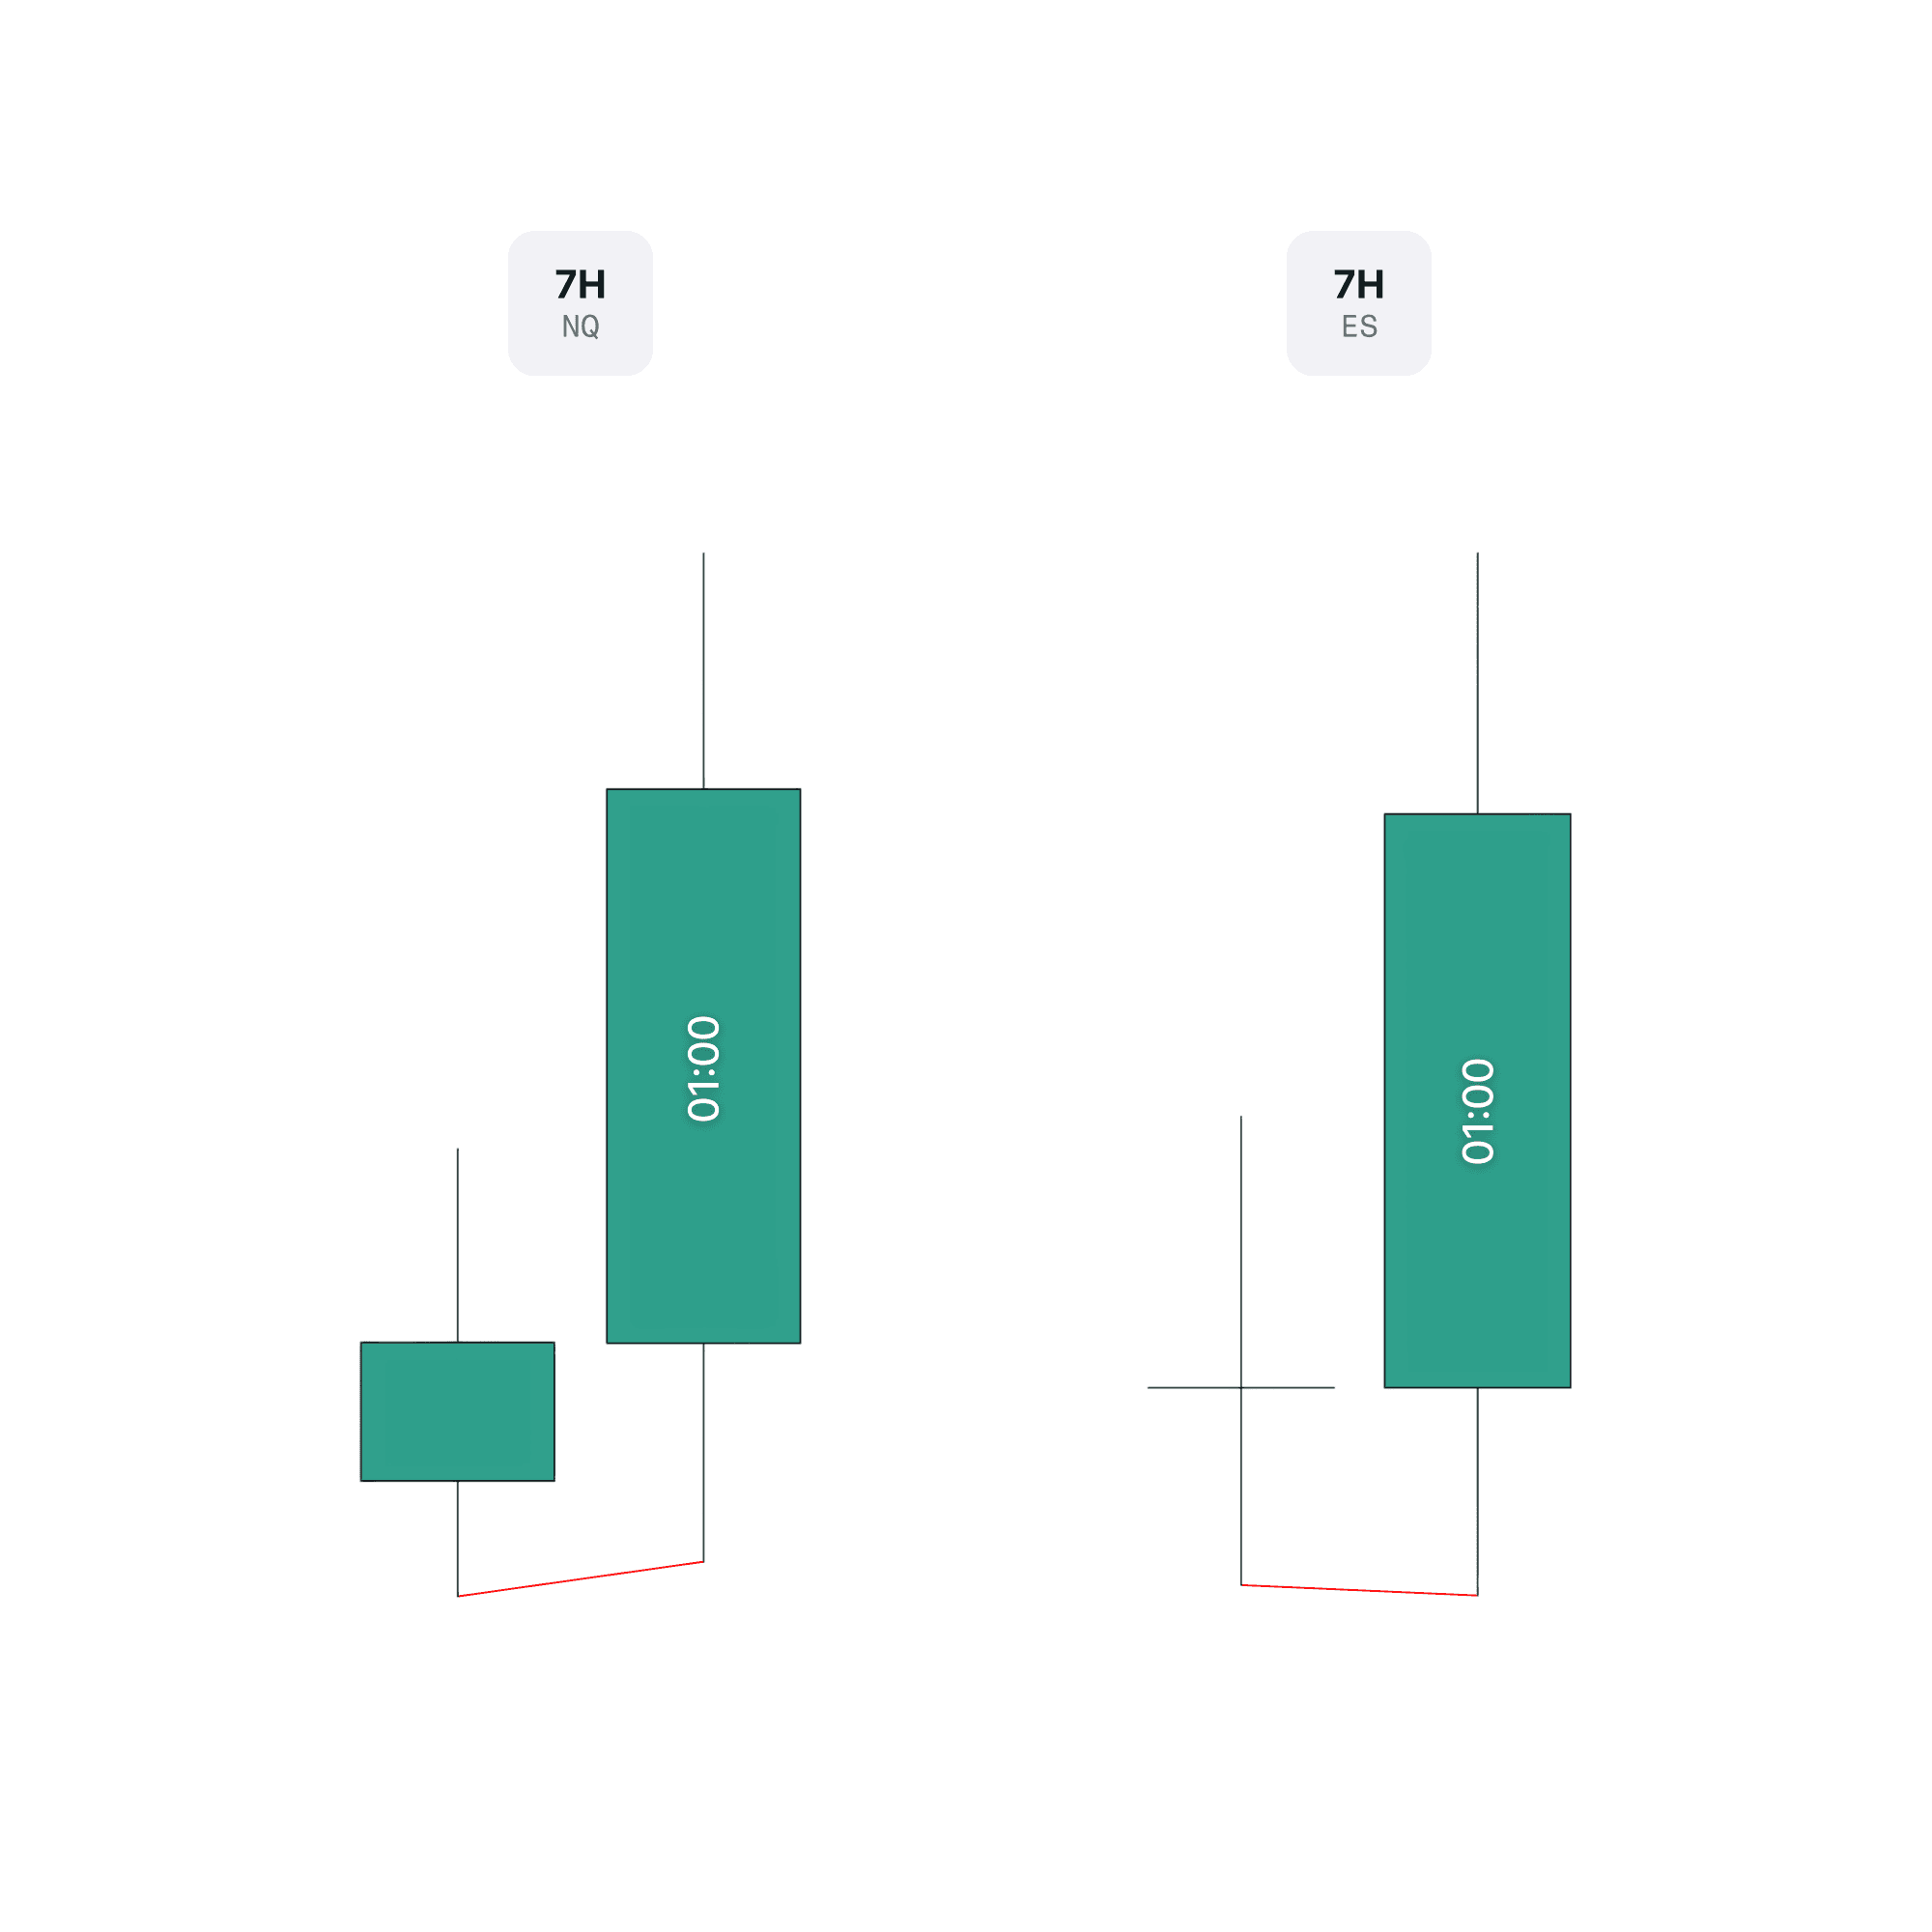
Comparing the session development between NQ and ES as correlated pairs, there is a divergence off the session lows inside of the daily profile. This is added confluence as both profiles are aligned with the bias and confirm the expectation for the 08:00 candle to be in the continuation of the daily candle.
With the understanding that both the daily candle and 08:00 candle are set to expand to the upside, the next step is to determine how to frame the low of the 08:00 candle. On the 1h timeframe for an intermediate perspective, the 08:00 candle is opening above valid downclose candles in the continuation. This is what we expect to be respected and how the low of the New York session to expand off of.
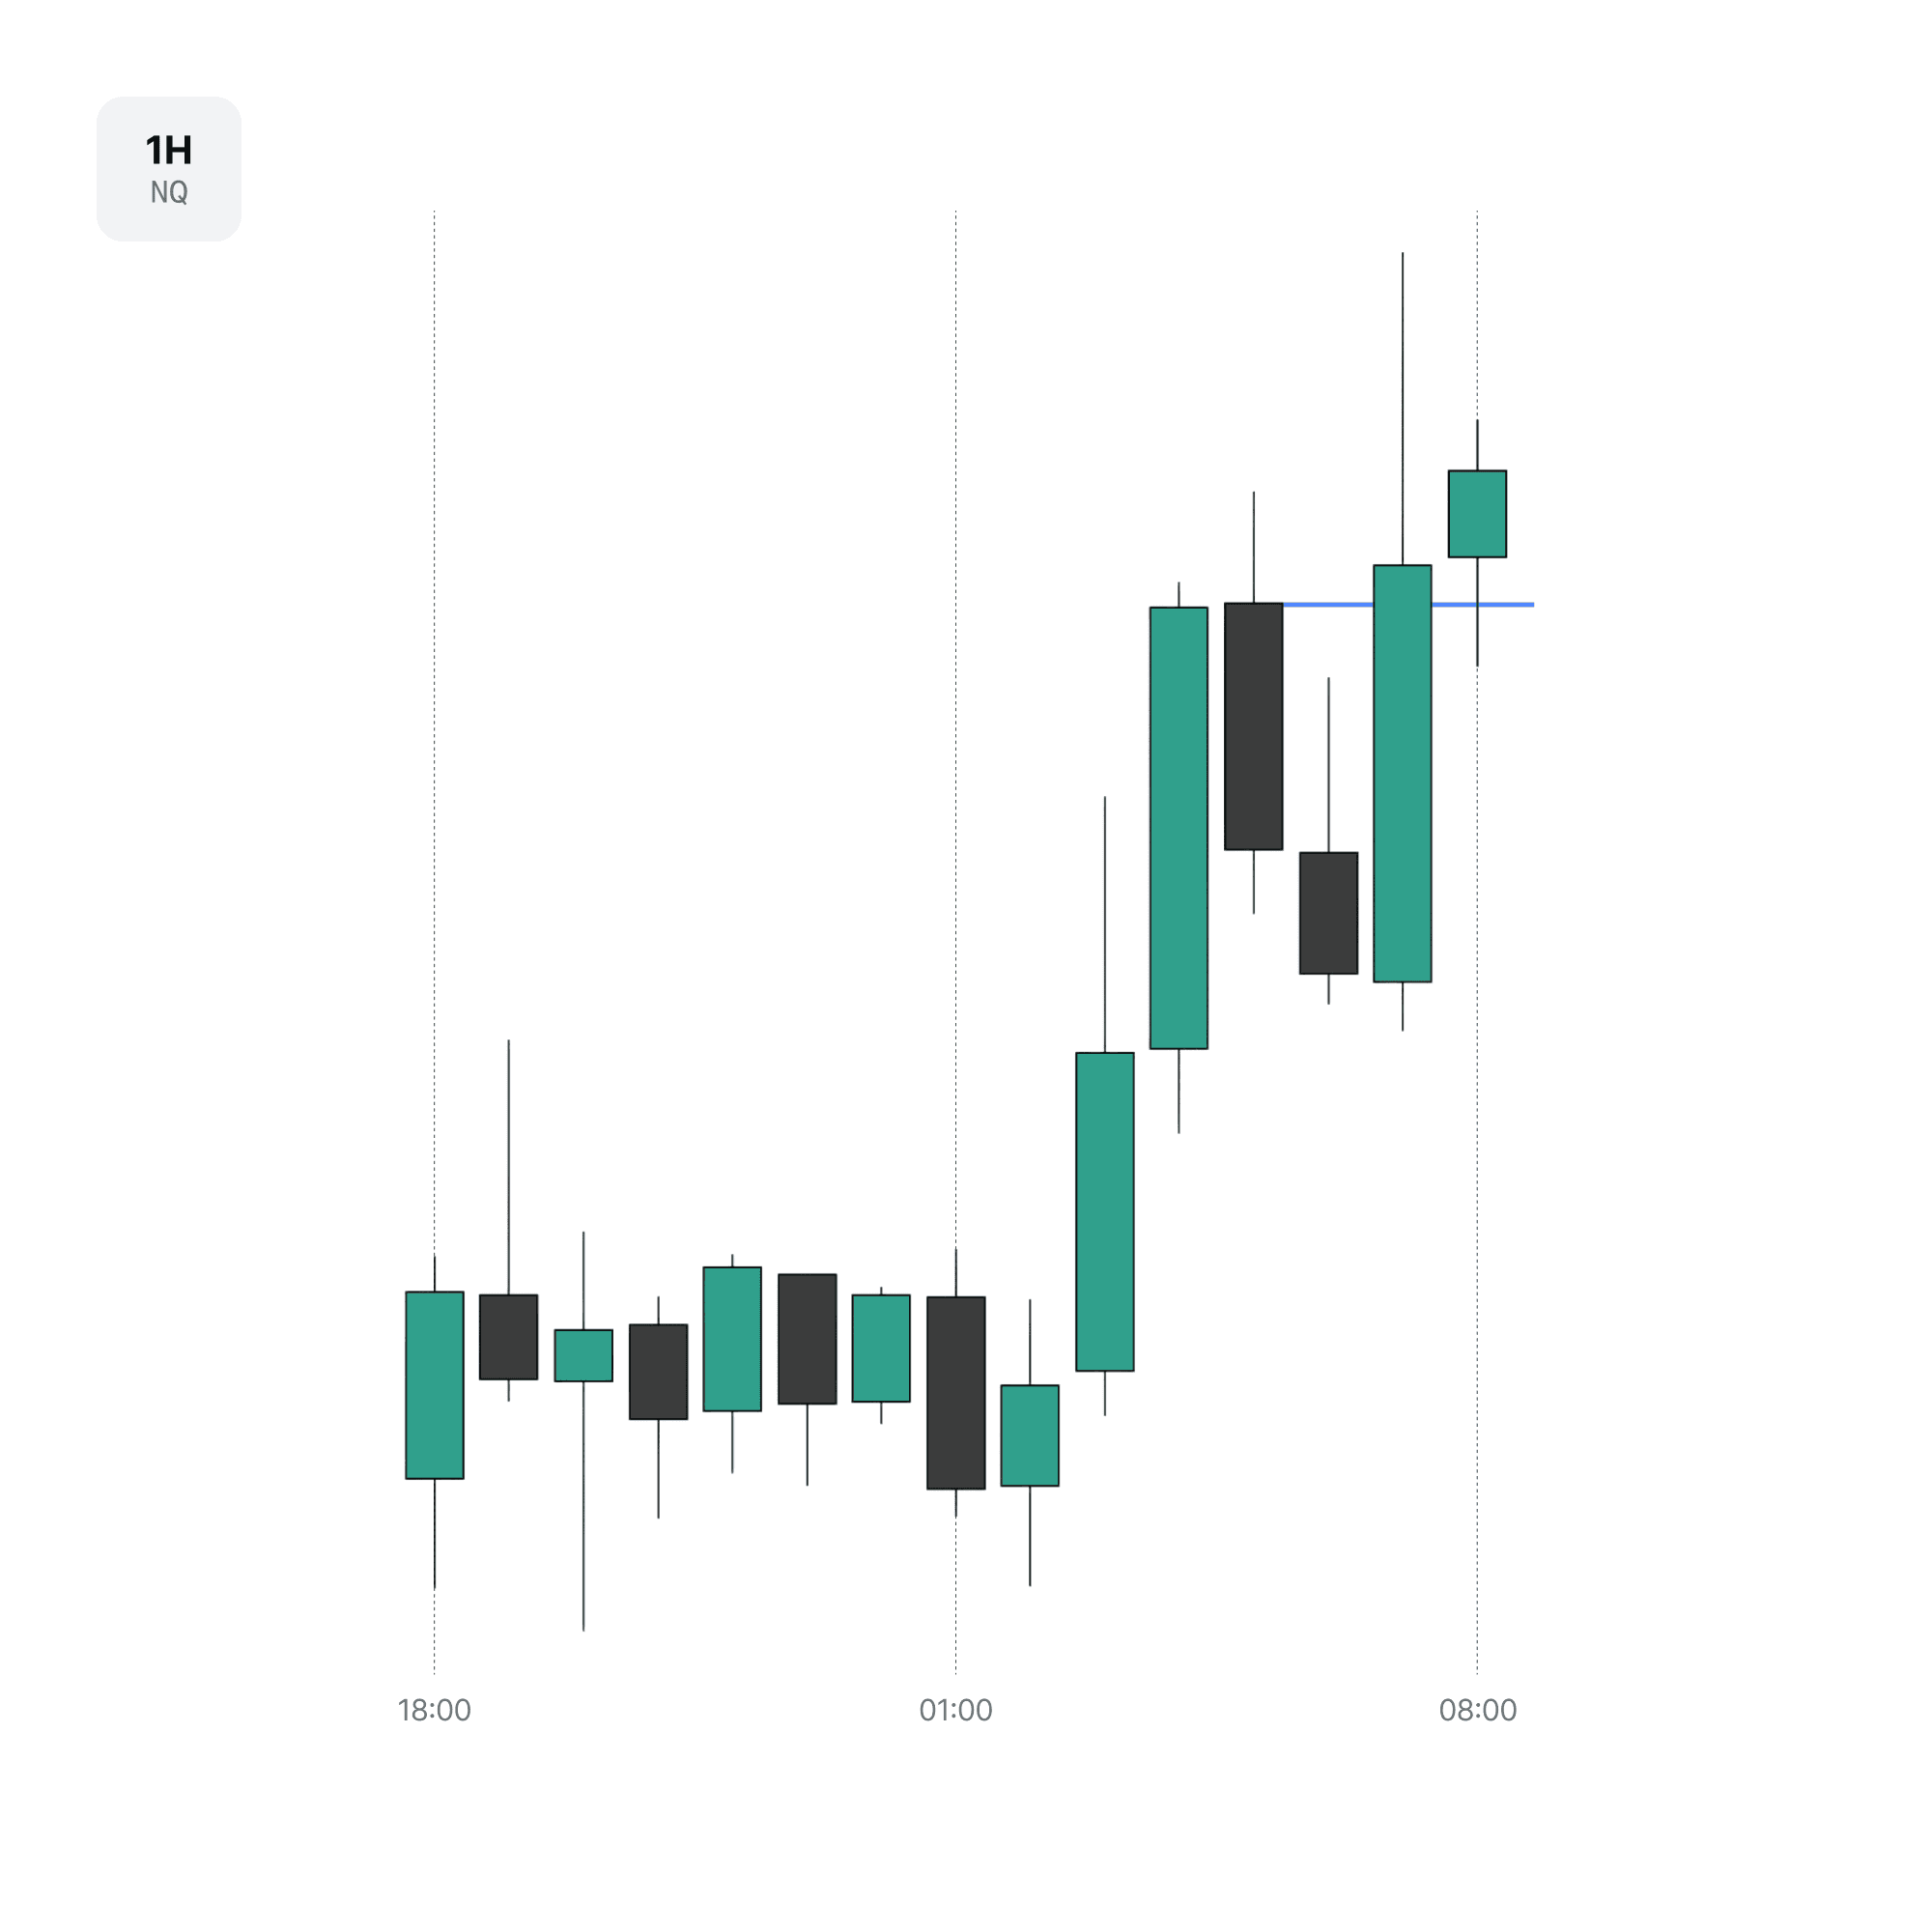
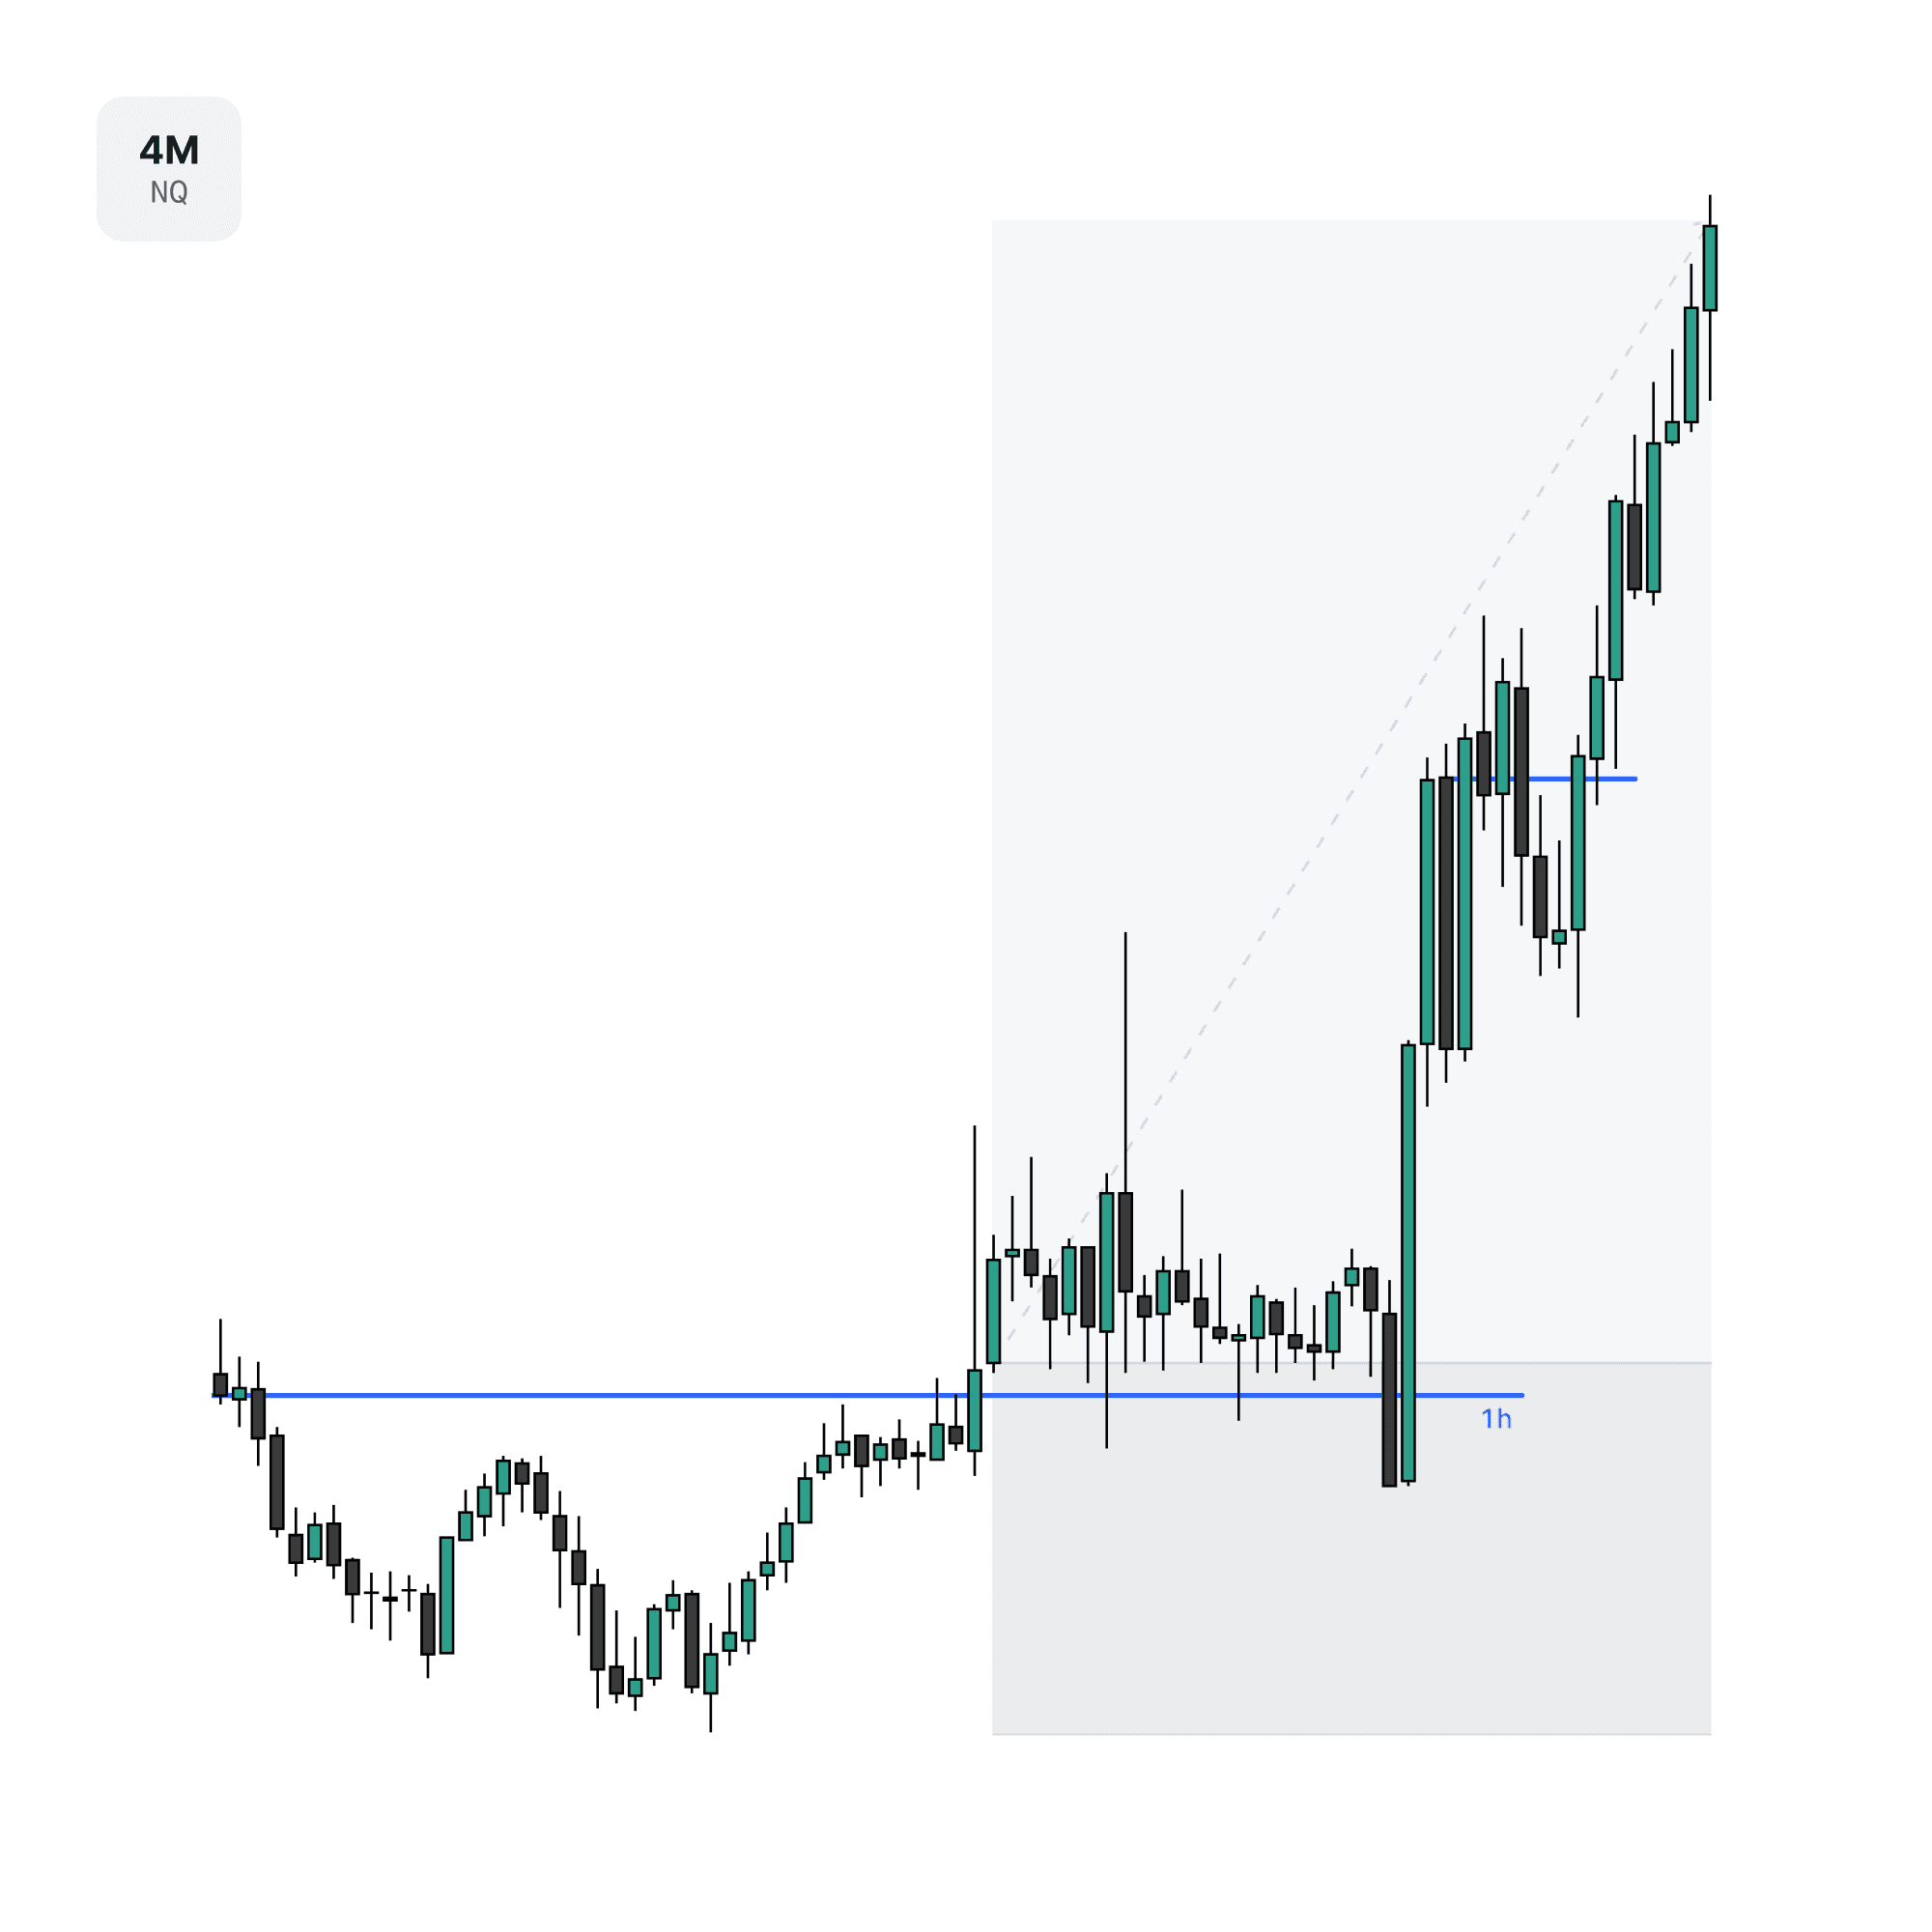
Not only does the 1h signature provide an entry to position on for the continuation, but the new 4m signature allows for an additional pyramid entry. This means the trade can be increased on size while risk remains controlled once the stop loss is trailed to the new invalidation point. Watch the live execution clip for this entire trade in the linked YouTube video below.
Prop
Learn
Explore mentorship with

AM and

TTrades
The standard of trading guidance
Prop
Learn
Get funded with the prop
firms I trade with
Use code AM for the best discount
Watch on YouTube
Ideal Reversal Day Trade Breakdown
Price gapped down upon the new week open around a relevant low. The development shows a manipulation reaction with an opposing target at the highs to reach into for the New York session. This is an ideal reversal day to trade as there is a small wick on the daily candle which supports expansion. These are reversal conditions we want to participate in versus a large wick reversal day which has reduced probability for a sustained and directional expansion move.
With the daily candle already holding an expectation to expand to the opposing relevant high above as the target, the next step is to align the daily profile. This is a bullish 18:00 reversal profile as the 18:00 candle manipulated the daily relevant low and the 01:00 candle held away. We assume the 08:00 candle is already in the continuation for the day.
The upper wick on the 01:00 candle is providing information that is important to framing the low of the 08:00 candle. That wick will be downclose candles on an intermediate timeframe and once closed through will be respected in the continuation.
Inside of that same highlighted range of the upper wick, the downclose candles can be viewed on the 30m timeframe. The closure above confirms the low of the 08:00 candle that we will look to trade away from inside of this day. This is the framework of the daily profile that will be entered alongside of.
The entry signature in the continuation is provided after retesting and respecting to the 30m downclose candles from the previous image. Paired with a divergence for confluence, the new closure through the refined signature is where the trade is placed to get onside with the assumed move higher for the New York session.
Allowing the trade to play out, the 9:30 open expands price higher to the objective while respecting the stop loss on the invalidation point of the signature. This is a prime example of not micromanaging positions. When a trade is put on, before it either stops out or breaks in the direction of the idea, most management should be hands off. We do not want to step in the way of valid frameworks.
Moving back out to the 7h timeframe, you can see the logic playing out.
Framework is established off the daily with relevant swings
Daily profile alignment is confirmation and provides New York expectation
Low of the 08:00 candle is framed off the 30m downclose candles
Entry is positioned in relation to the session candle
Ideal Continuation Day Trade Breakdown
With the previous day follow through, the engagement of relevant swings on the daily suggests the next day to be a continuation higher. There is a confirmed manipulation off the lows and a breakout signature through the highs.
Allowing the 18:00 and 01:00 candle to print, the daily profile on NQ is showing a bullish 18:00 reversal profile. This is one that sets the 08:00 candle to be the continuation. However, there is more confluence that can be added to this.
Comparing the session development between NQ and ES as correlated pairs, there is a divergence off the session lows inside of the daily profile. This is added confluence as both profiles are aligned with the bias and confirm the expectation for the 08:00 candle to be in the continuation of the daily candle.
With the understanding that both the daily candle and 08:00 candle are set to expand to the upside, the next step is to determine how to frame the low of the 08:00 candle. On the 1h timeframe for an intermediate perspective, the 08:00 candle is opening above valid downclose candles in the continuation. This is what we expect to be respected and how the low of the New York session to expand off of.
Not only does the 1h signature provide an entry to position on for the continuation, but the new 4m signature allows for an additional pyramid entry. This means the trade can be increased on size while risk remains controlled once the stop loss is trailed to the new invalidation point. Watch the live execution clip for this entire trade in the linked YouTube video below.
Prop
Learn
Get funded with the prop firms I trade with
Use code AM for the best discount


Prop
Learn
Explore mentorship with
AM and
TTrades

Prop
Learn
Get funded with the prop firms I trade with
Use code AM for the best discount
Prop
Learn
Explore mentorship with
AM and
TTrades
Prop
Learn
Explore mentorship with
AM and
TTrades
The standard of trading guidance
Prop
Learn
Get funded with the prop
firms I trade with
Use code AM for the best discount
Prop
Learn
Explore mentorship with
AM and
TTrades
The standard of trading guidance
Prop
Learn
Get funded with the prop
firms I trade with
Use code AM for the best discount

The Ideal Reversal and Continuation Setups
Continue Learning.


© 2026 AM Trades. All Rights Reserved.
© 2026 AM Trades. All Rights Reserved.


© 2026 AM Trades. All Rights Reserved.