


Introduction to Relevant Swings for Daily Bias
Model
Introduction to Relevant Swings for Daily Bias
Relevant swings are a concept used to simplify how highs and lows are identified on the chart. The goal is to use only a few steps on the daily timeframe to place focus at the current extremes of price to remove the guesswork of which reactions in the market actually matter.
The Problem and the Solution
Every high quality trade begins with higher timeframe framework. Without it, execution becomes reactive and bias shifts with every short-term price move. Many traders assume building framework requires mastering complex concepts, yet the reality is far more simple. It begins with identifying highs and lows correctly and understanding which ones truly hold weight in the market.
Within my system, every trade is built on what I define as relevant swings. This concept is part of each decision I make. Relevant swings define where opportunity exists, which side of the market to focus on, and when the market is structured to expand. When applied properly, they eliminate unnecessary noise in the charts and anchor bias to objective extremes.
This lesson will break down the exact three-step process used inside my framework to identify and use daily relevant swings with consistency.
The Real Objective of Relevant Swings
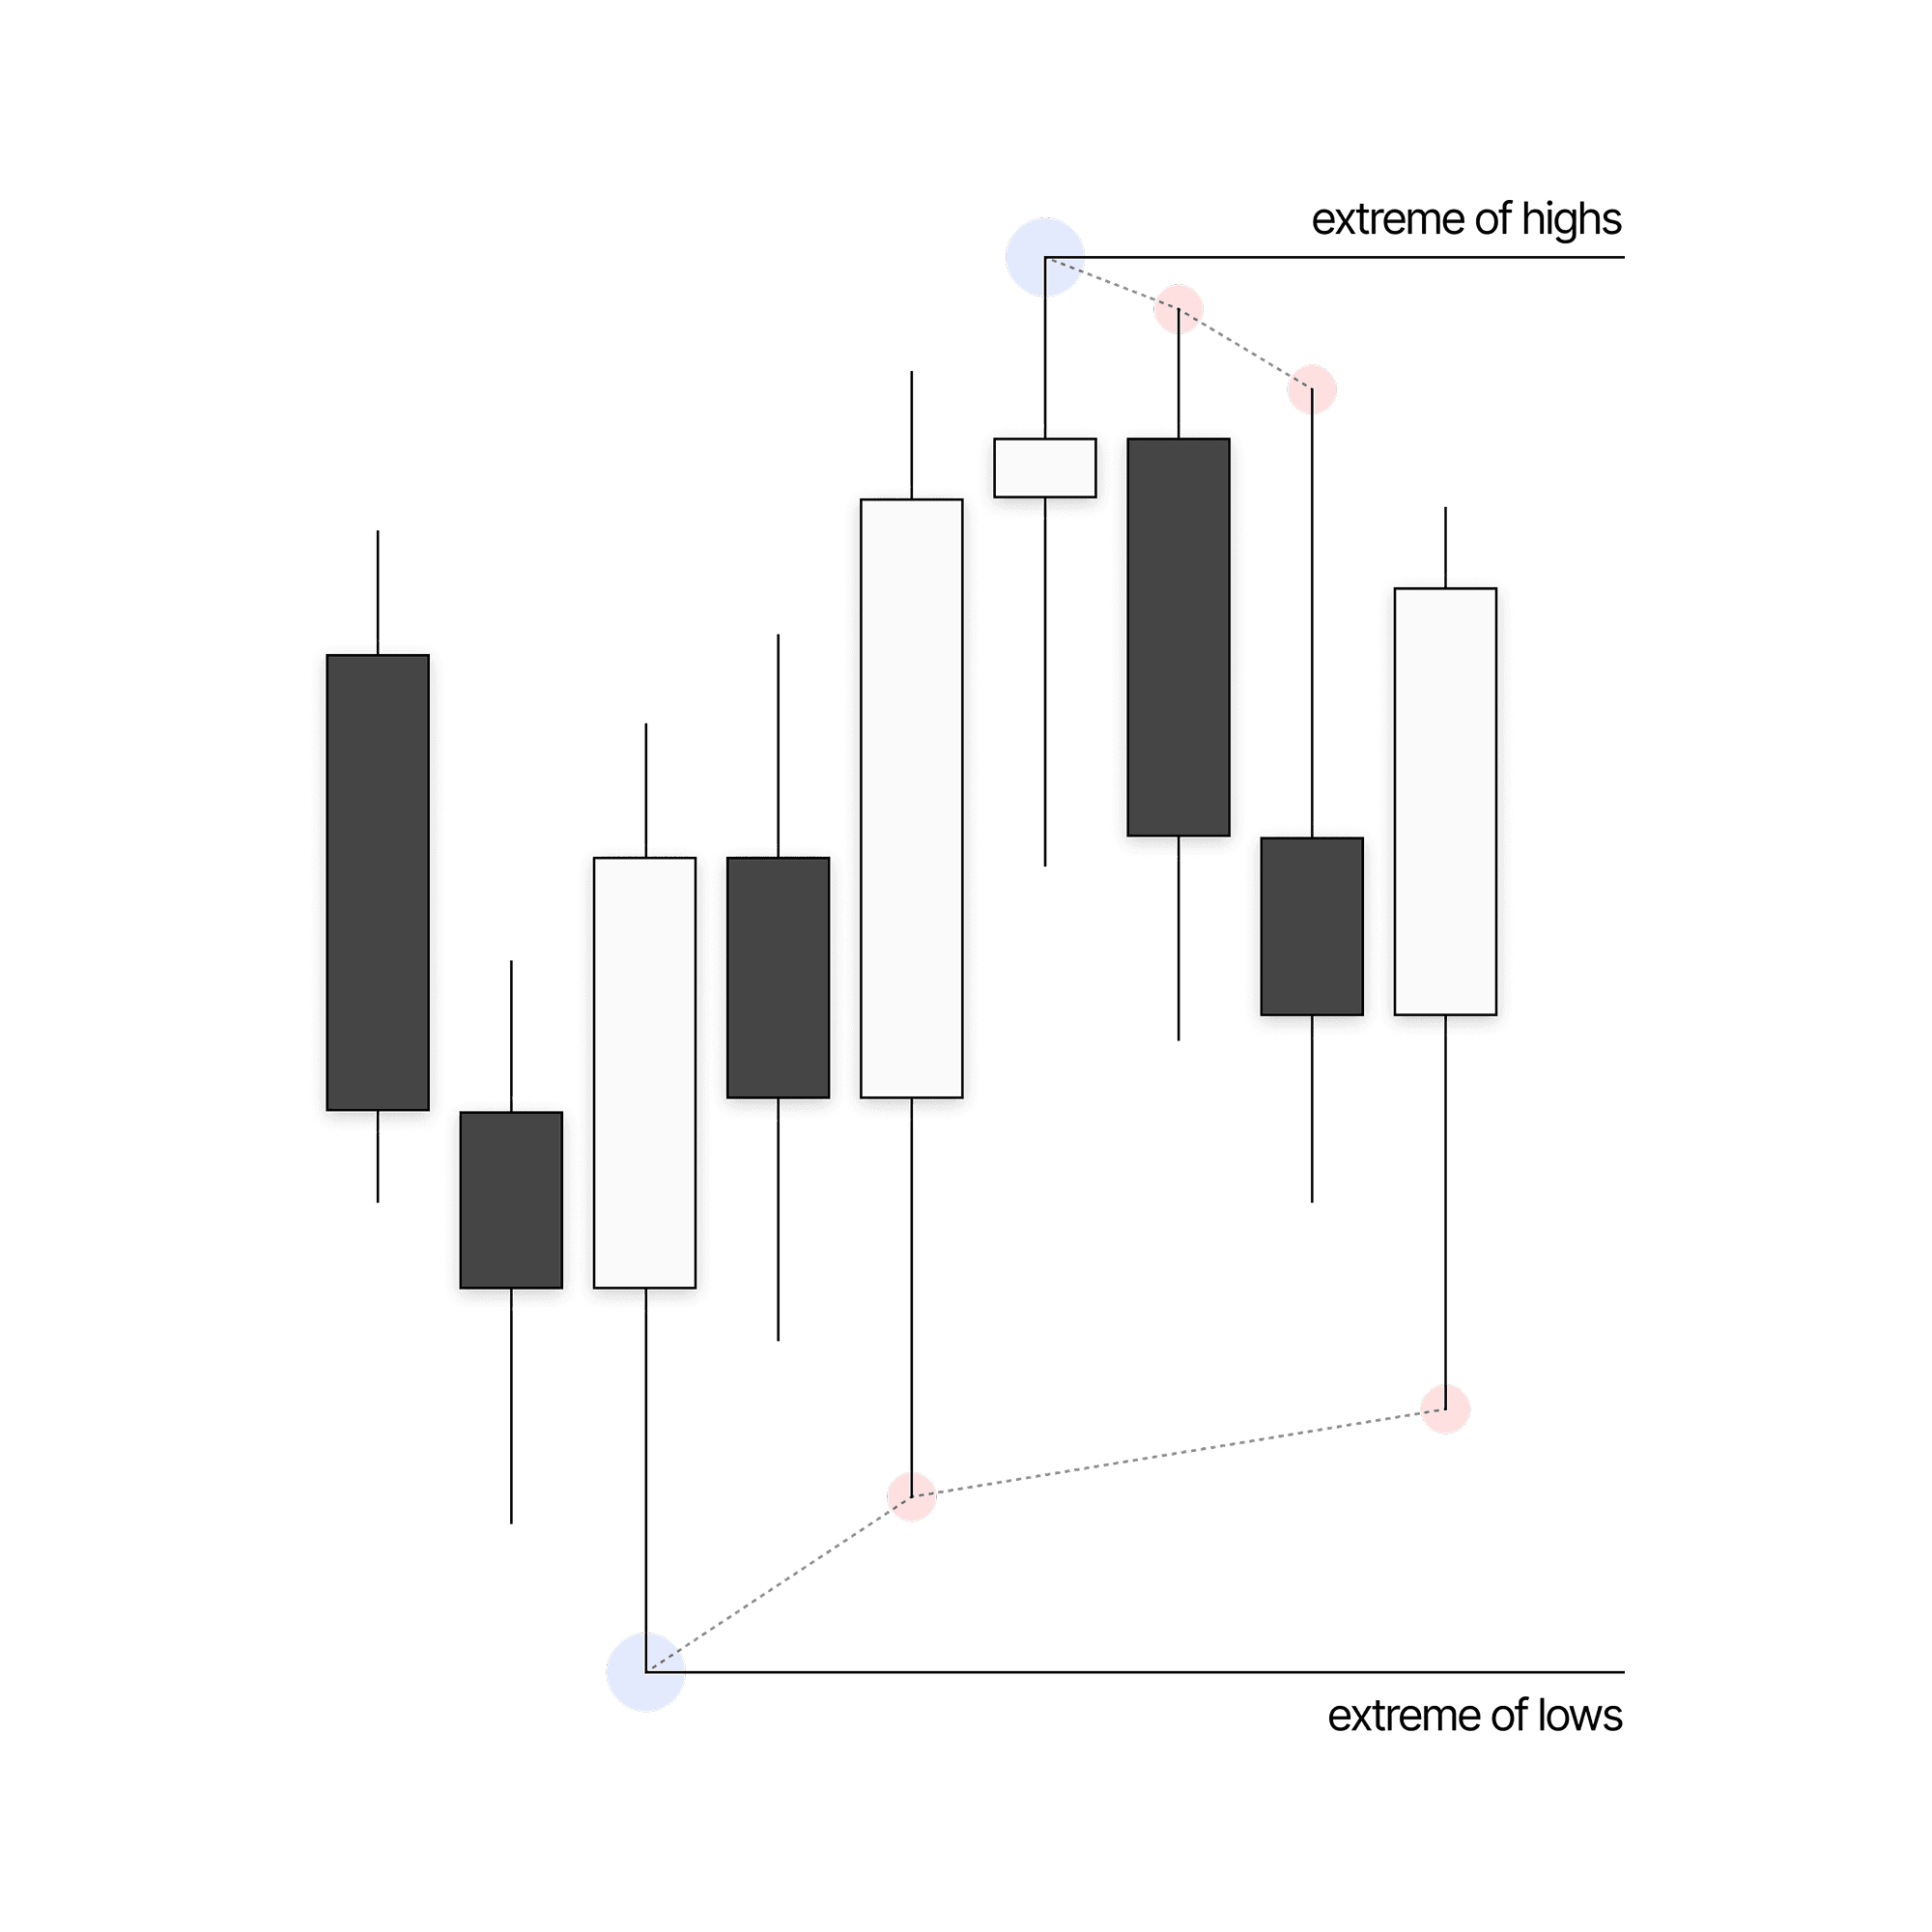
The goal of identifying relevant swings is not only to mark highs and lows. It is to remove doubt. Most traders clutter their charts with session highs and lows, opening ranges, and levels pulled from multiple timeframes. The result is always confusion and conflicting signals.
Relevant swings simplify this process by focusing only on extremes relative to the current market range. When price reaches an extreme and reacts, that reaction carries weight without any doubt. It is meaningful because it occurs at the outer boundary of the active range. Anything that is not an extreme becomes secondary and often irrelevant.
By focusing on extremes and filtering out internal noise, we gain clarity. That clarity becomes the basis for our framework.
Step One: Understanding Failure Swings
The first concept you must understand is the failure swing. This is the most important principle in identifying relevant highs and lows.
A failure swing occurs when price sets an initial high or low, then makes deep runs back into that level without running it out. If a low forms and price genuinely intends to reverse, it should expand away and retrace shallowly. When price repeatedly returns deep into that same level, it signals a lack of commitment to reversal. Those deep returns are failure swings.
Failure swings are not the extremes. They are evidence that the extreme sits elsewhere. When you identify an initial high or low and then observe deep runs back into it, you ignore the internal reactions and focus on the original extreme that price continues to reference.
Step Two: Valid Price Separation
Once you understand failure swings, the next step is evaluating separation between potential extremes.
On a daily chart, you may identify multiple highs or lows that appear relevant. The question becomes whether they are truly independent extremes or simply nested inside one another. This is where price separation becomes critical.
Valid separation exists when engaging one potential relevant swing would not automatically create a failure swing relative to another nearby level. If price can react at one low without forming a deep run into another low to its left, then those two lows are structurally separate. Both may qualify as relevant swings.
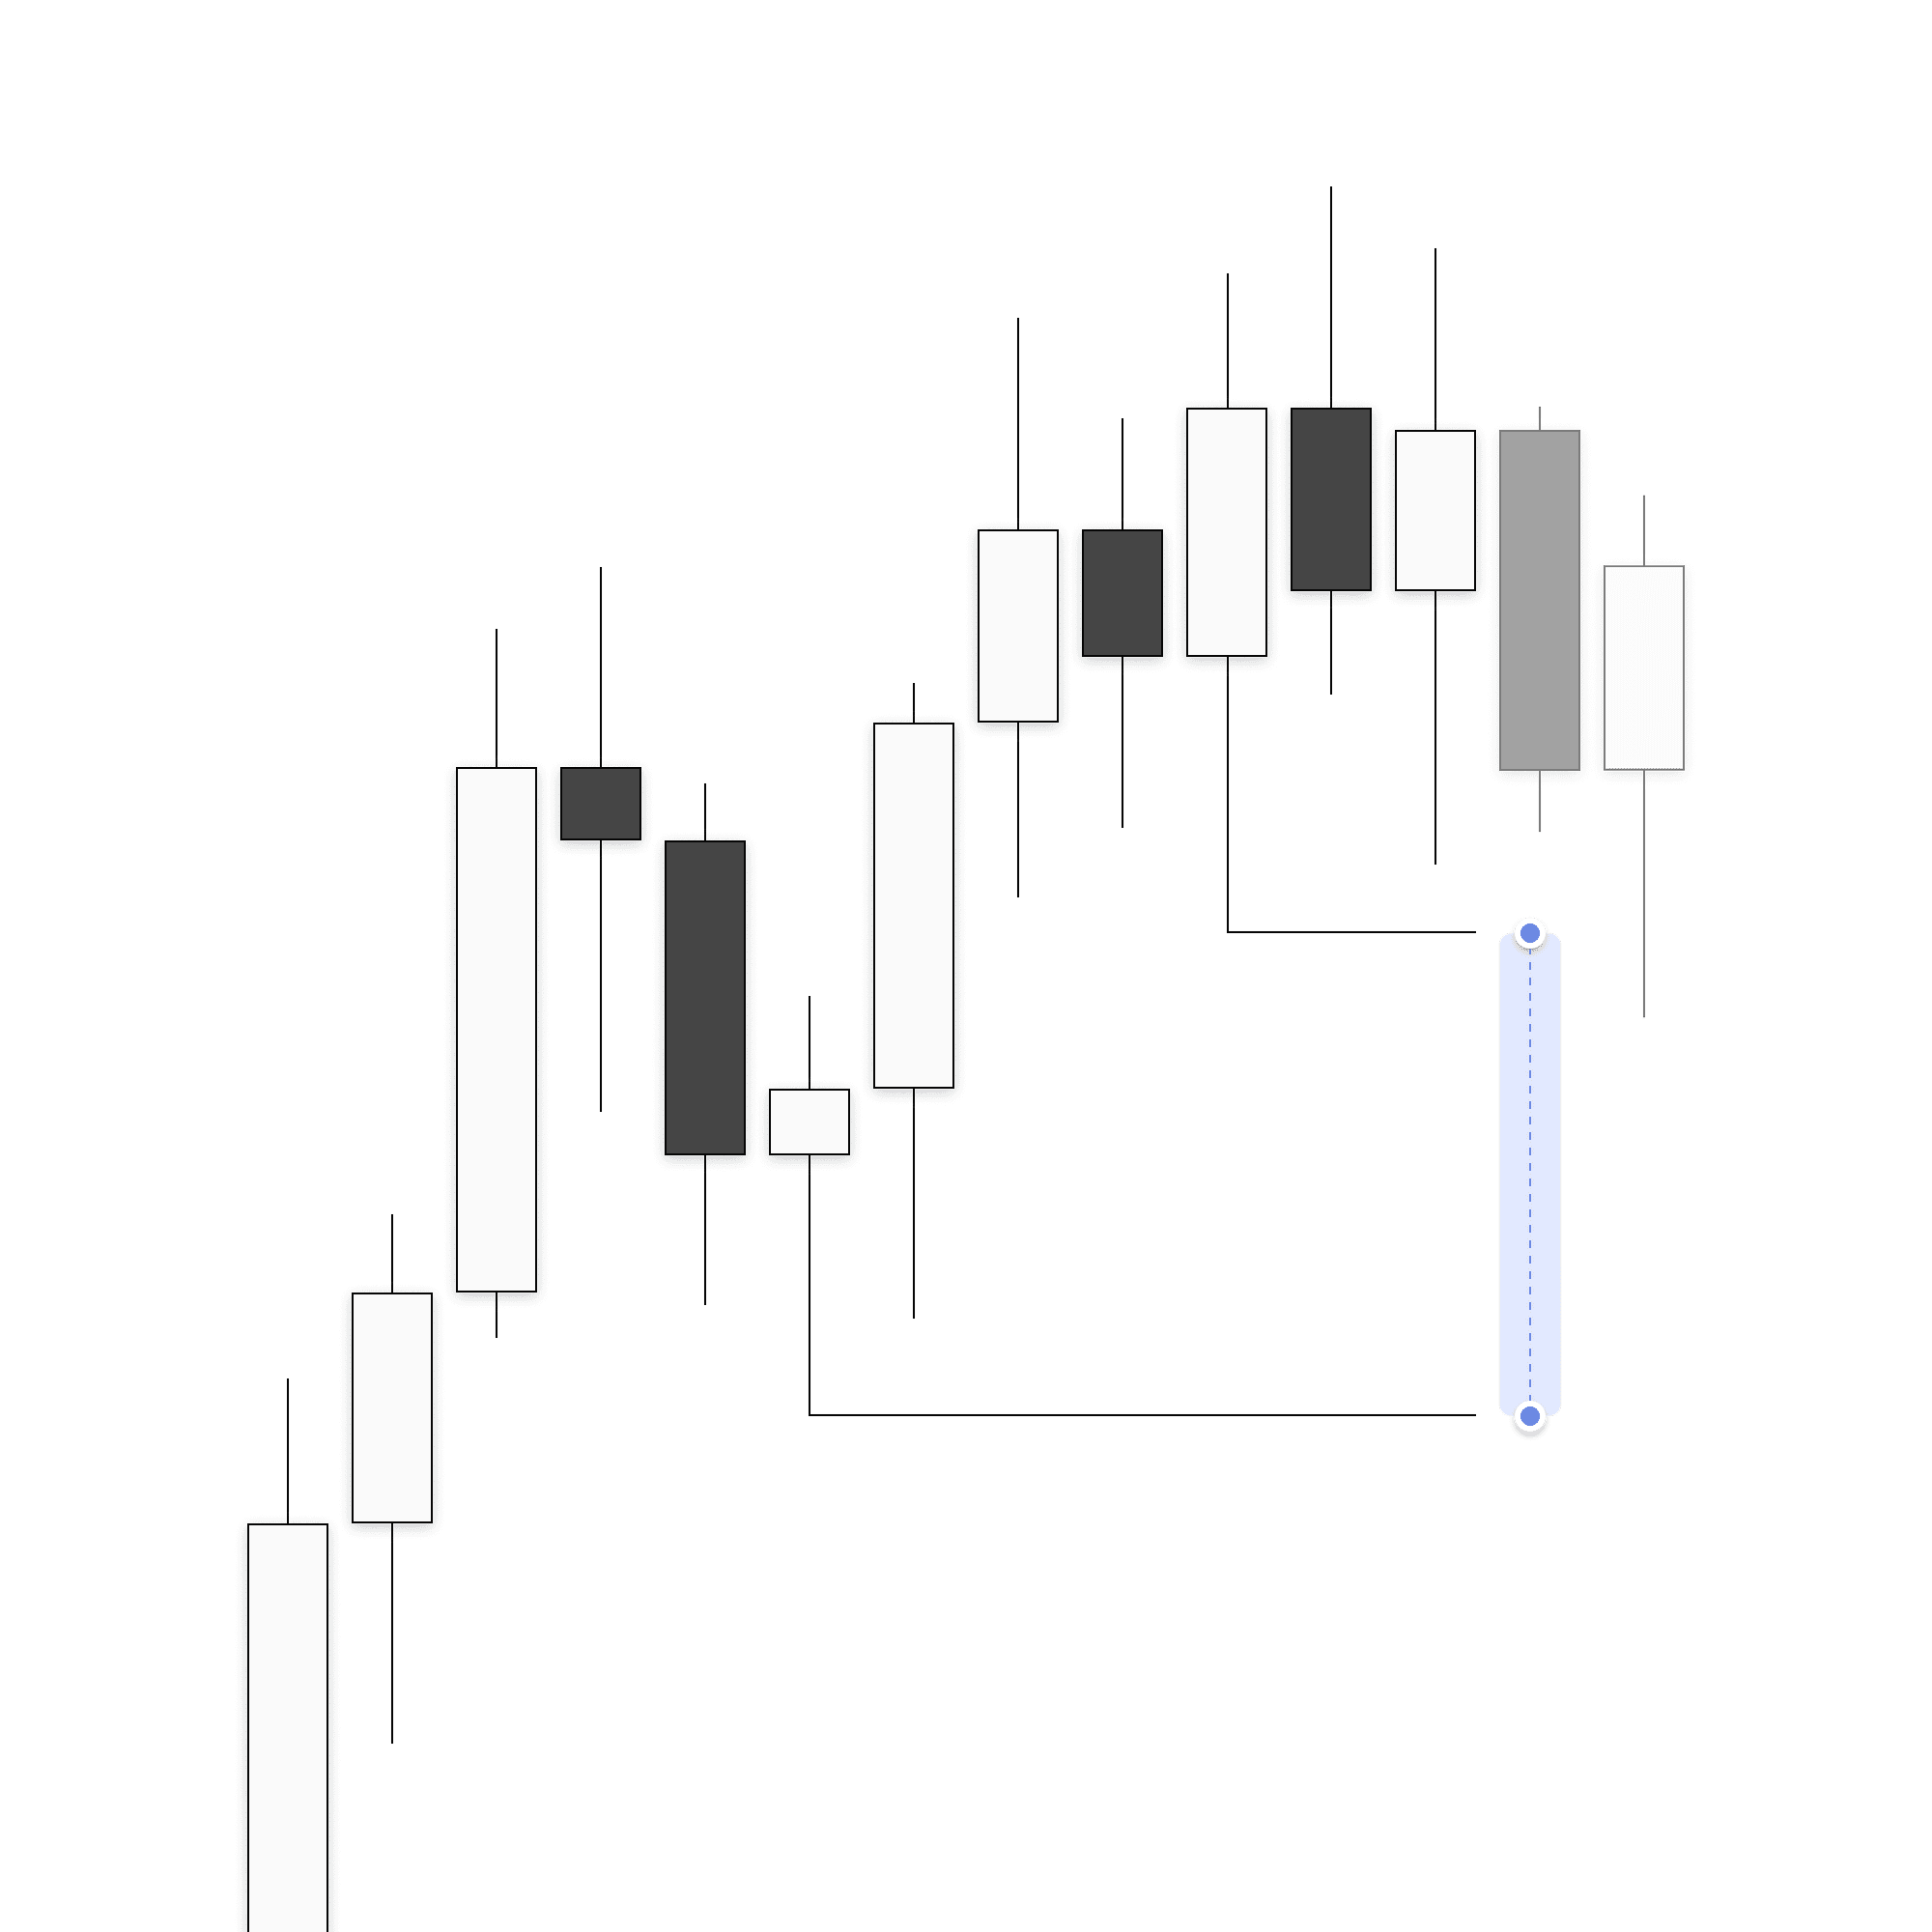
Invalid separation occurs when engaging one level would immediately create a failure swing into another nearby level. In that case, the first level is not truly independent. The deeper extreme is the only relevant swing.
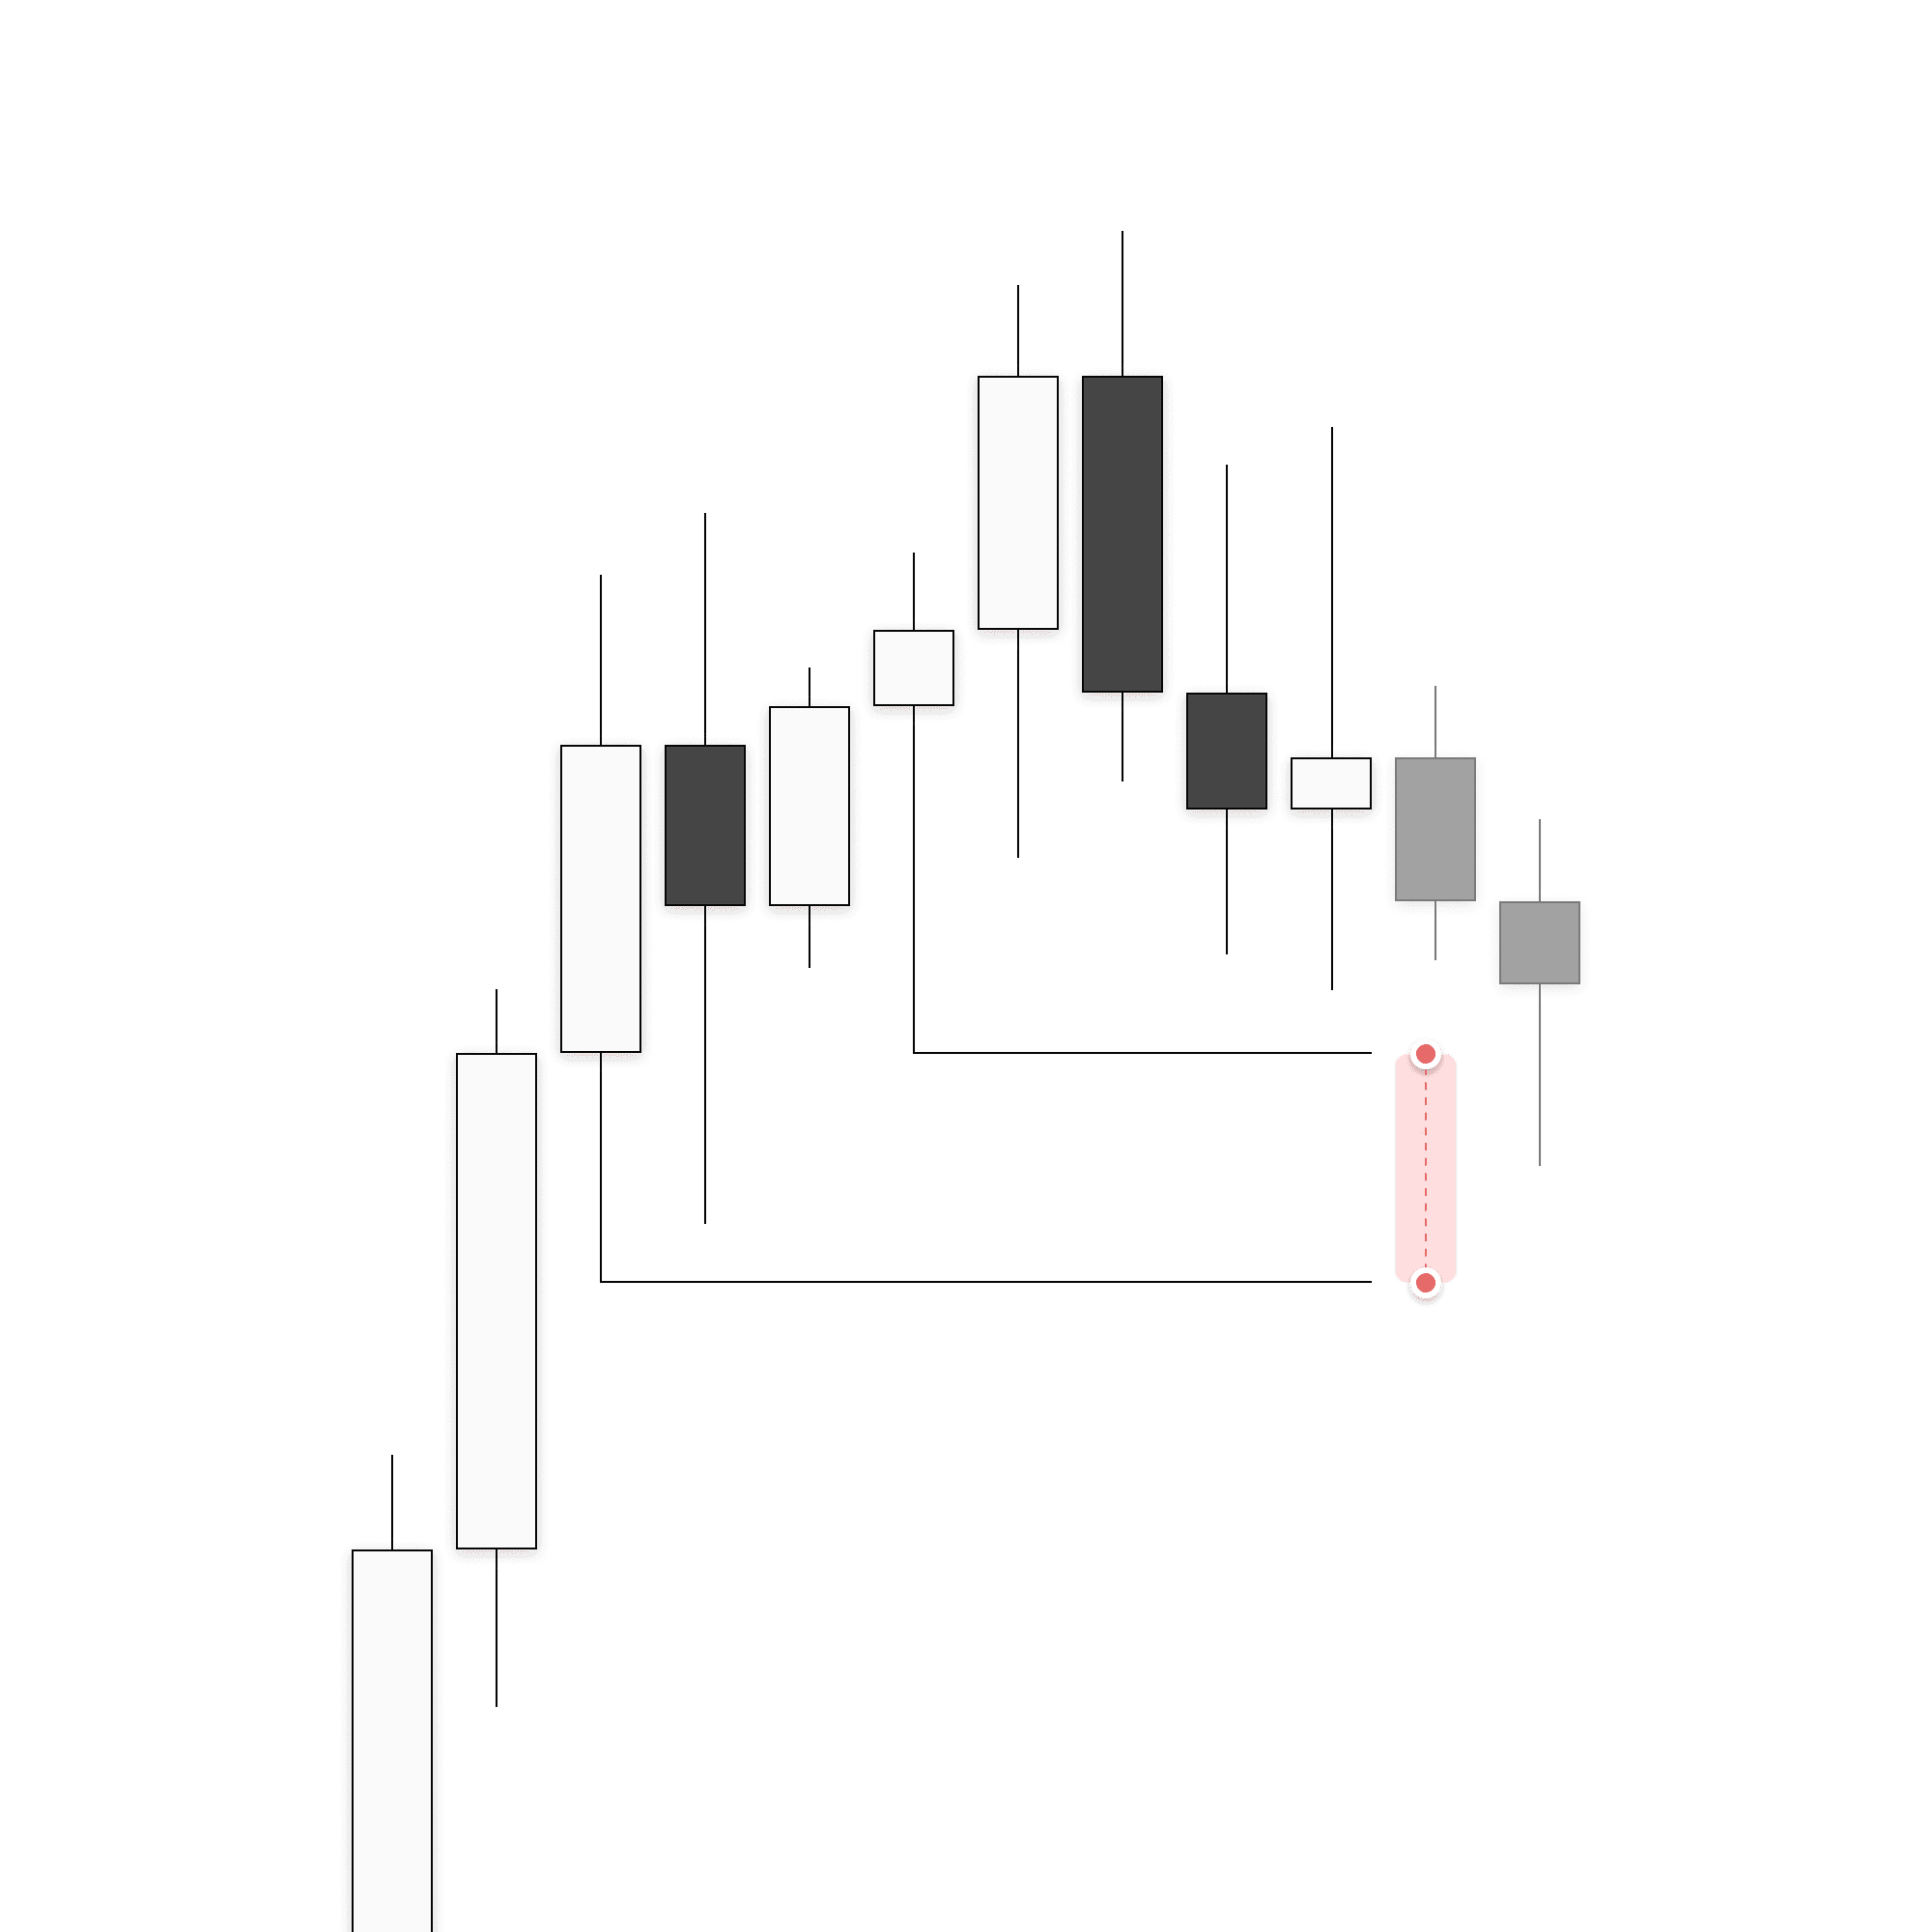
This concept prevents traders from over marking levels and reacting to points that do not carry structural weight. Valid separation ensures that when price reacts at a level, that reaction is meaningful and not structurally compromised.
Step Three: The 30-Day Lookback Period
The final step is defining your lookback range. Without limits, traders begin referencing highs and lows from months or even years ago, diluting relevance for intraday execution.
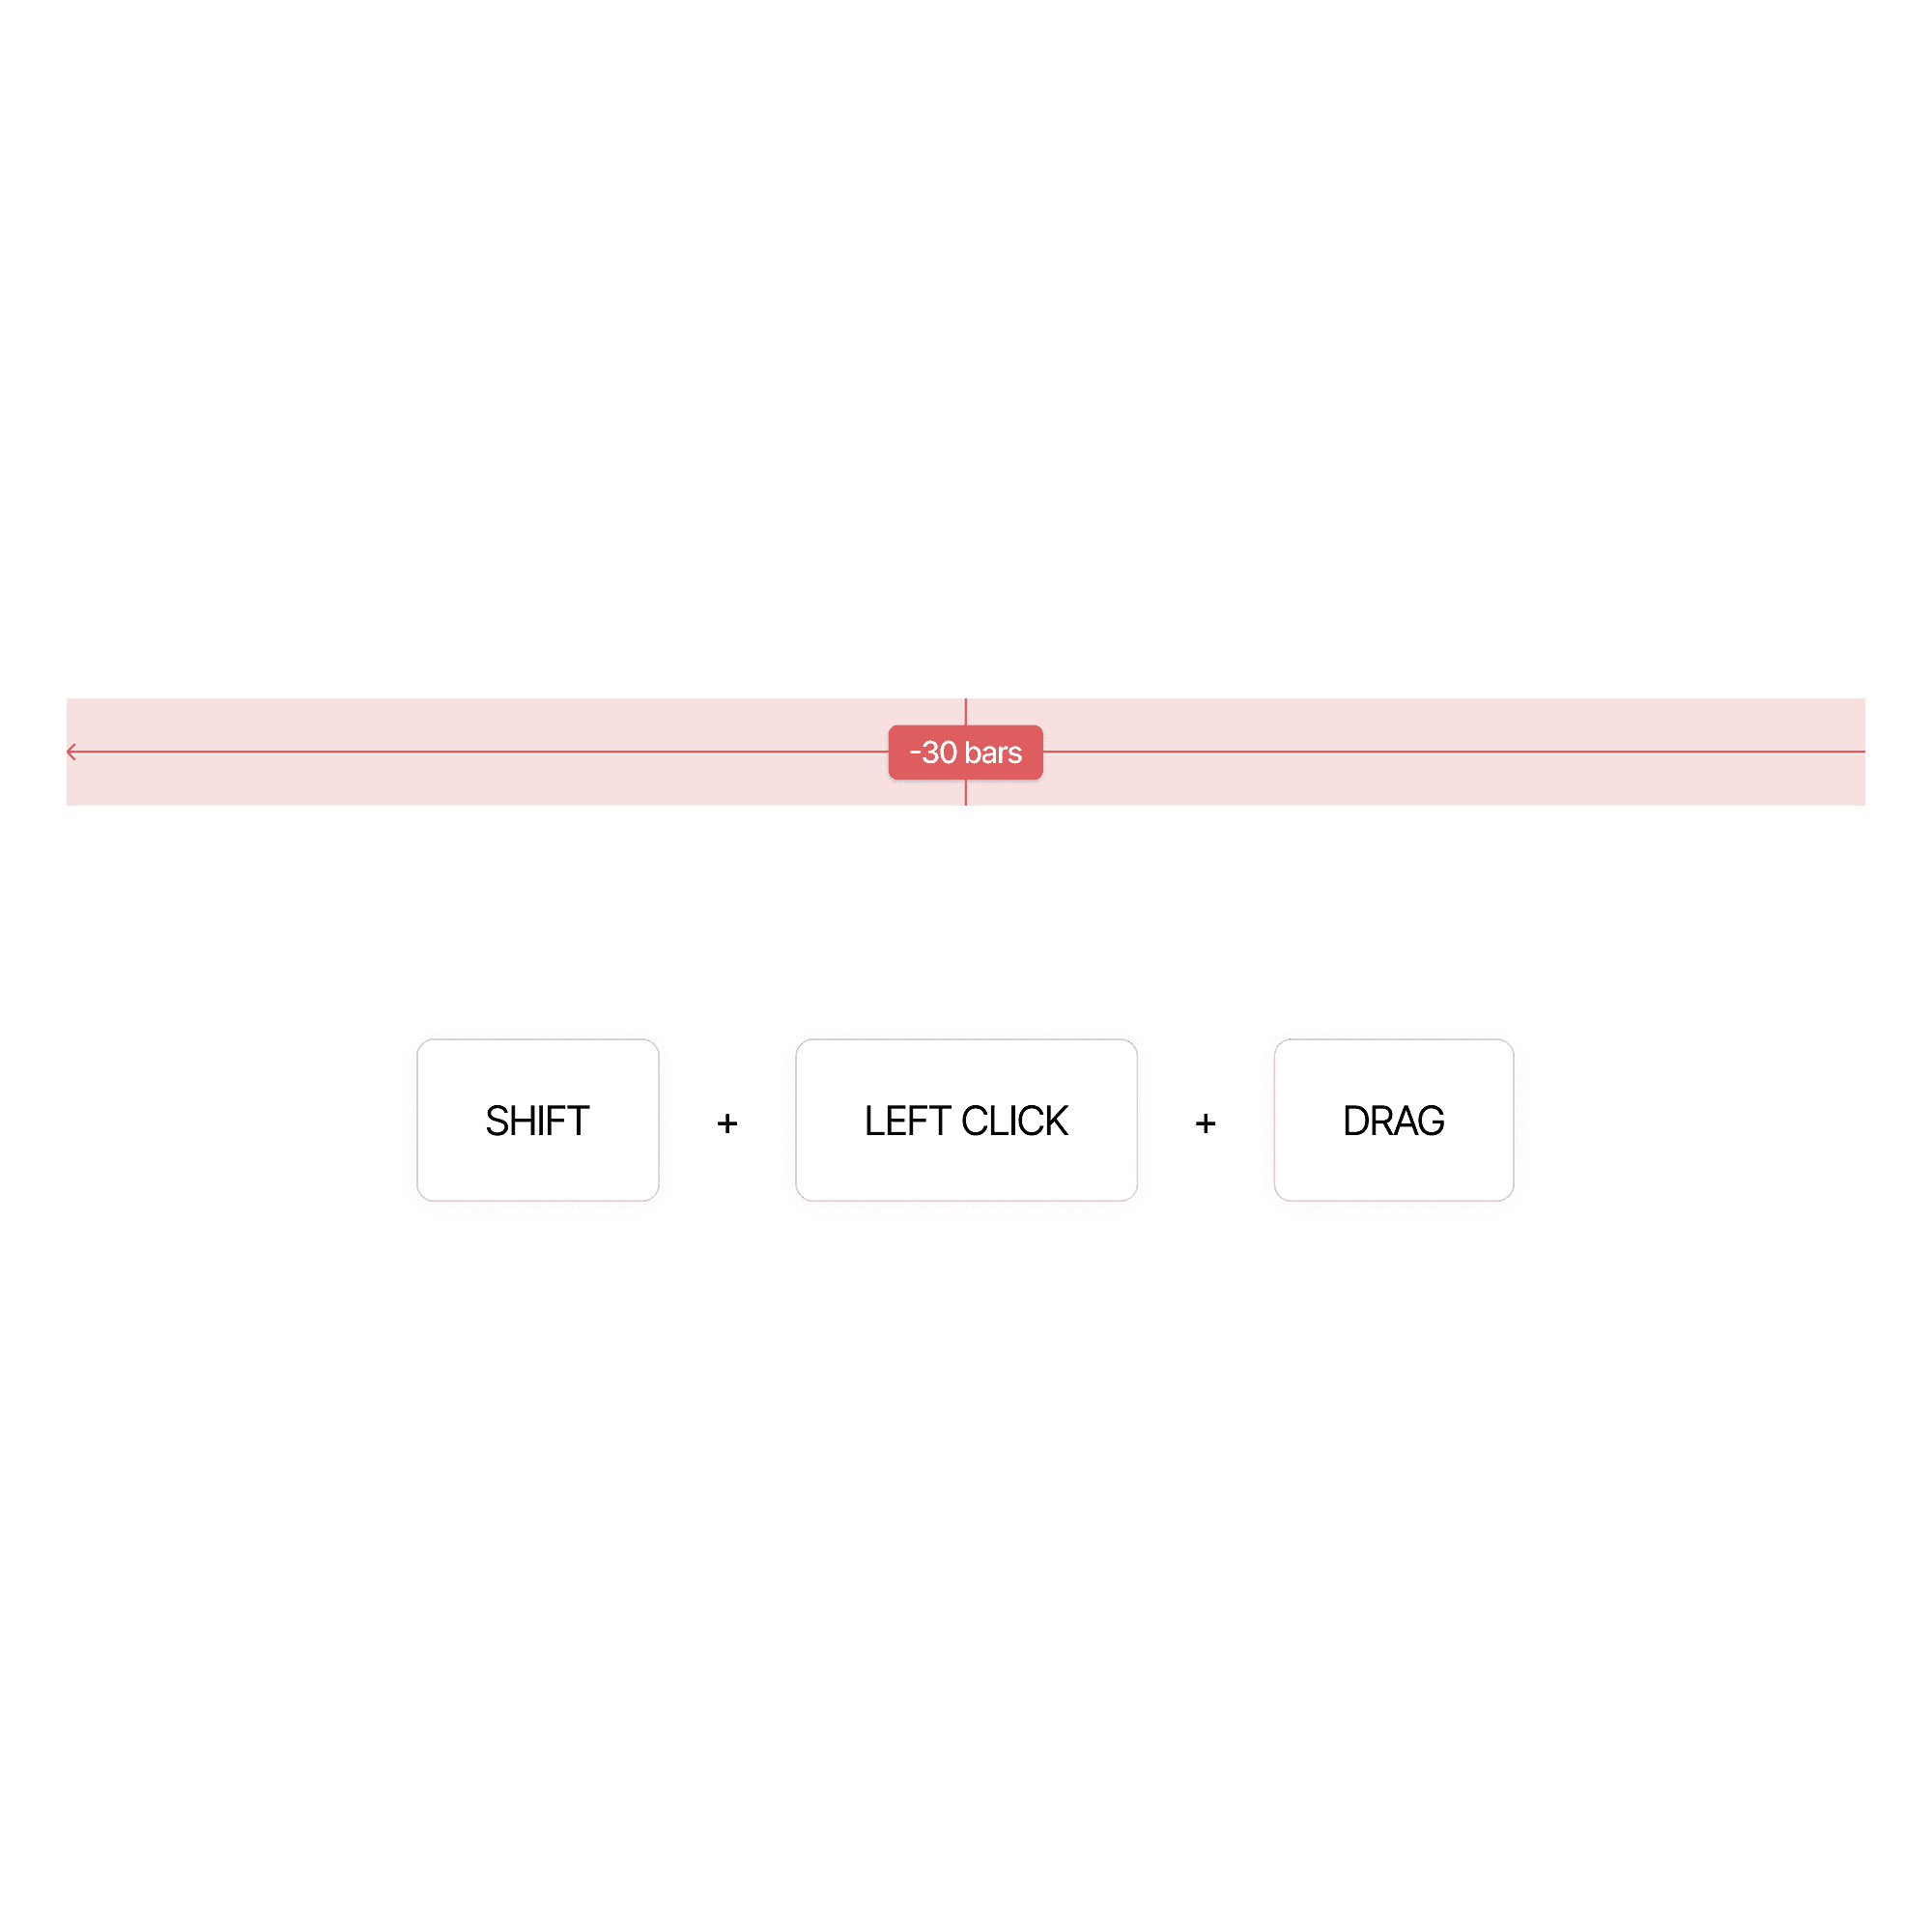
Inside my framework, I use a fixed 30 daily candle lookback period. Not 30 calendar days, but 30 completed daily candles. Anything beyond that range is excluded from consideration.
This constraint forces focus on recent market development. It keeps framework fluid and responsive to current conditions. Since we are day trading and holding trades for minutes to hours, our higher timeframe bias must reflect recent structural extremes, not distant historical levels. The 30 candle lookback creates clarity and prevents overanalysis.
In your TradingView chart, hover your cursor over the current daily candle. Then hold Shift, left click your mouse, and drag left until you see the bar counter show 30. This is the fastest way to determine this range in your charts.
How Reactions at Relevant Swings Create Bias
Identifying relevant swings is only the beginning. The actionable step comes from observing how price reacts when those extremes are engaged.
There are two primary reactions that matter. The first is manipulation. This occurs when price trades into a relevant high or low and closes back into the range. That reaction signals rejection at an extreme and often sets the stage for expansion in the opposite direction.
The second is decisive closure through a relevant swing. When price closes strongly beyond a relevant high or low, it signals continuation and expansion in that direction.
Because these reactions occur at extremes, they carry structural authority. A manipulation at a relevant low creates a bullish bias until price reaches an opposing relevant high. A decisive close through a relevant high reinforces continuation.
This is how daily framework translates into intraday opportunity.
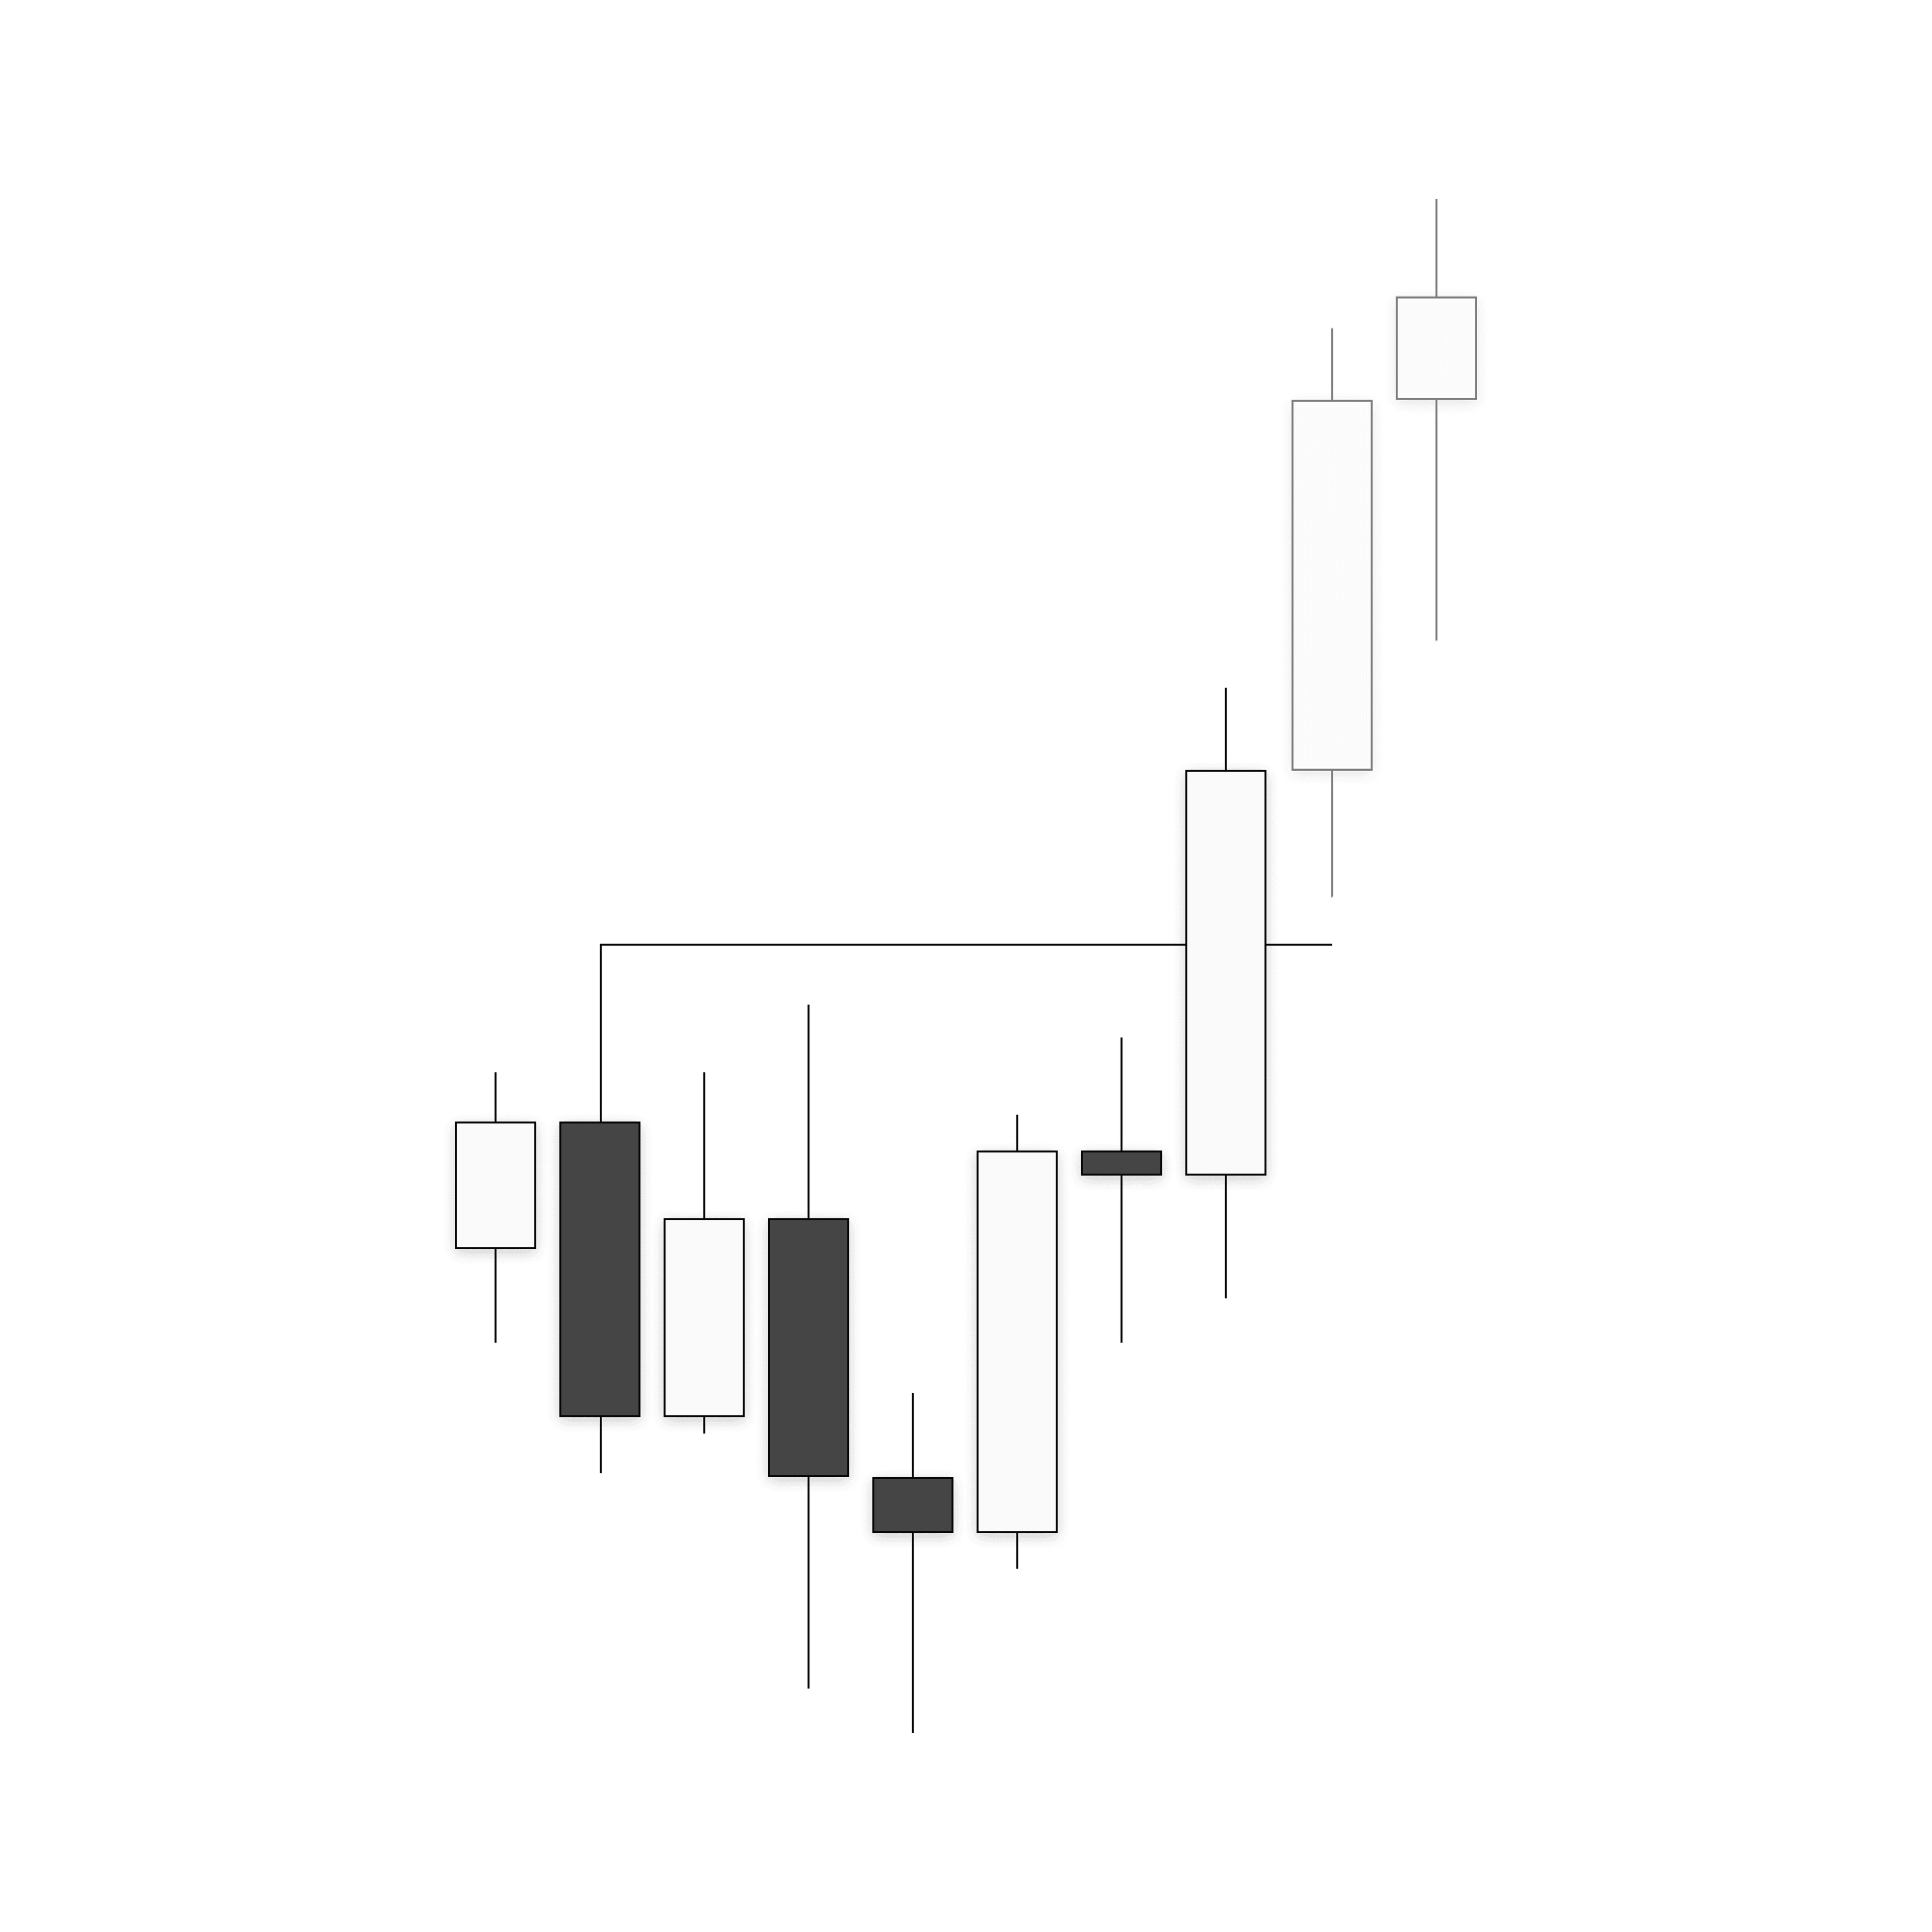
Real Chart Example and Practicing
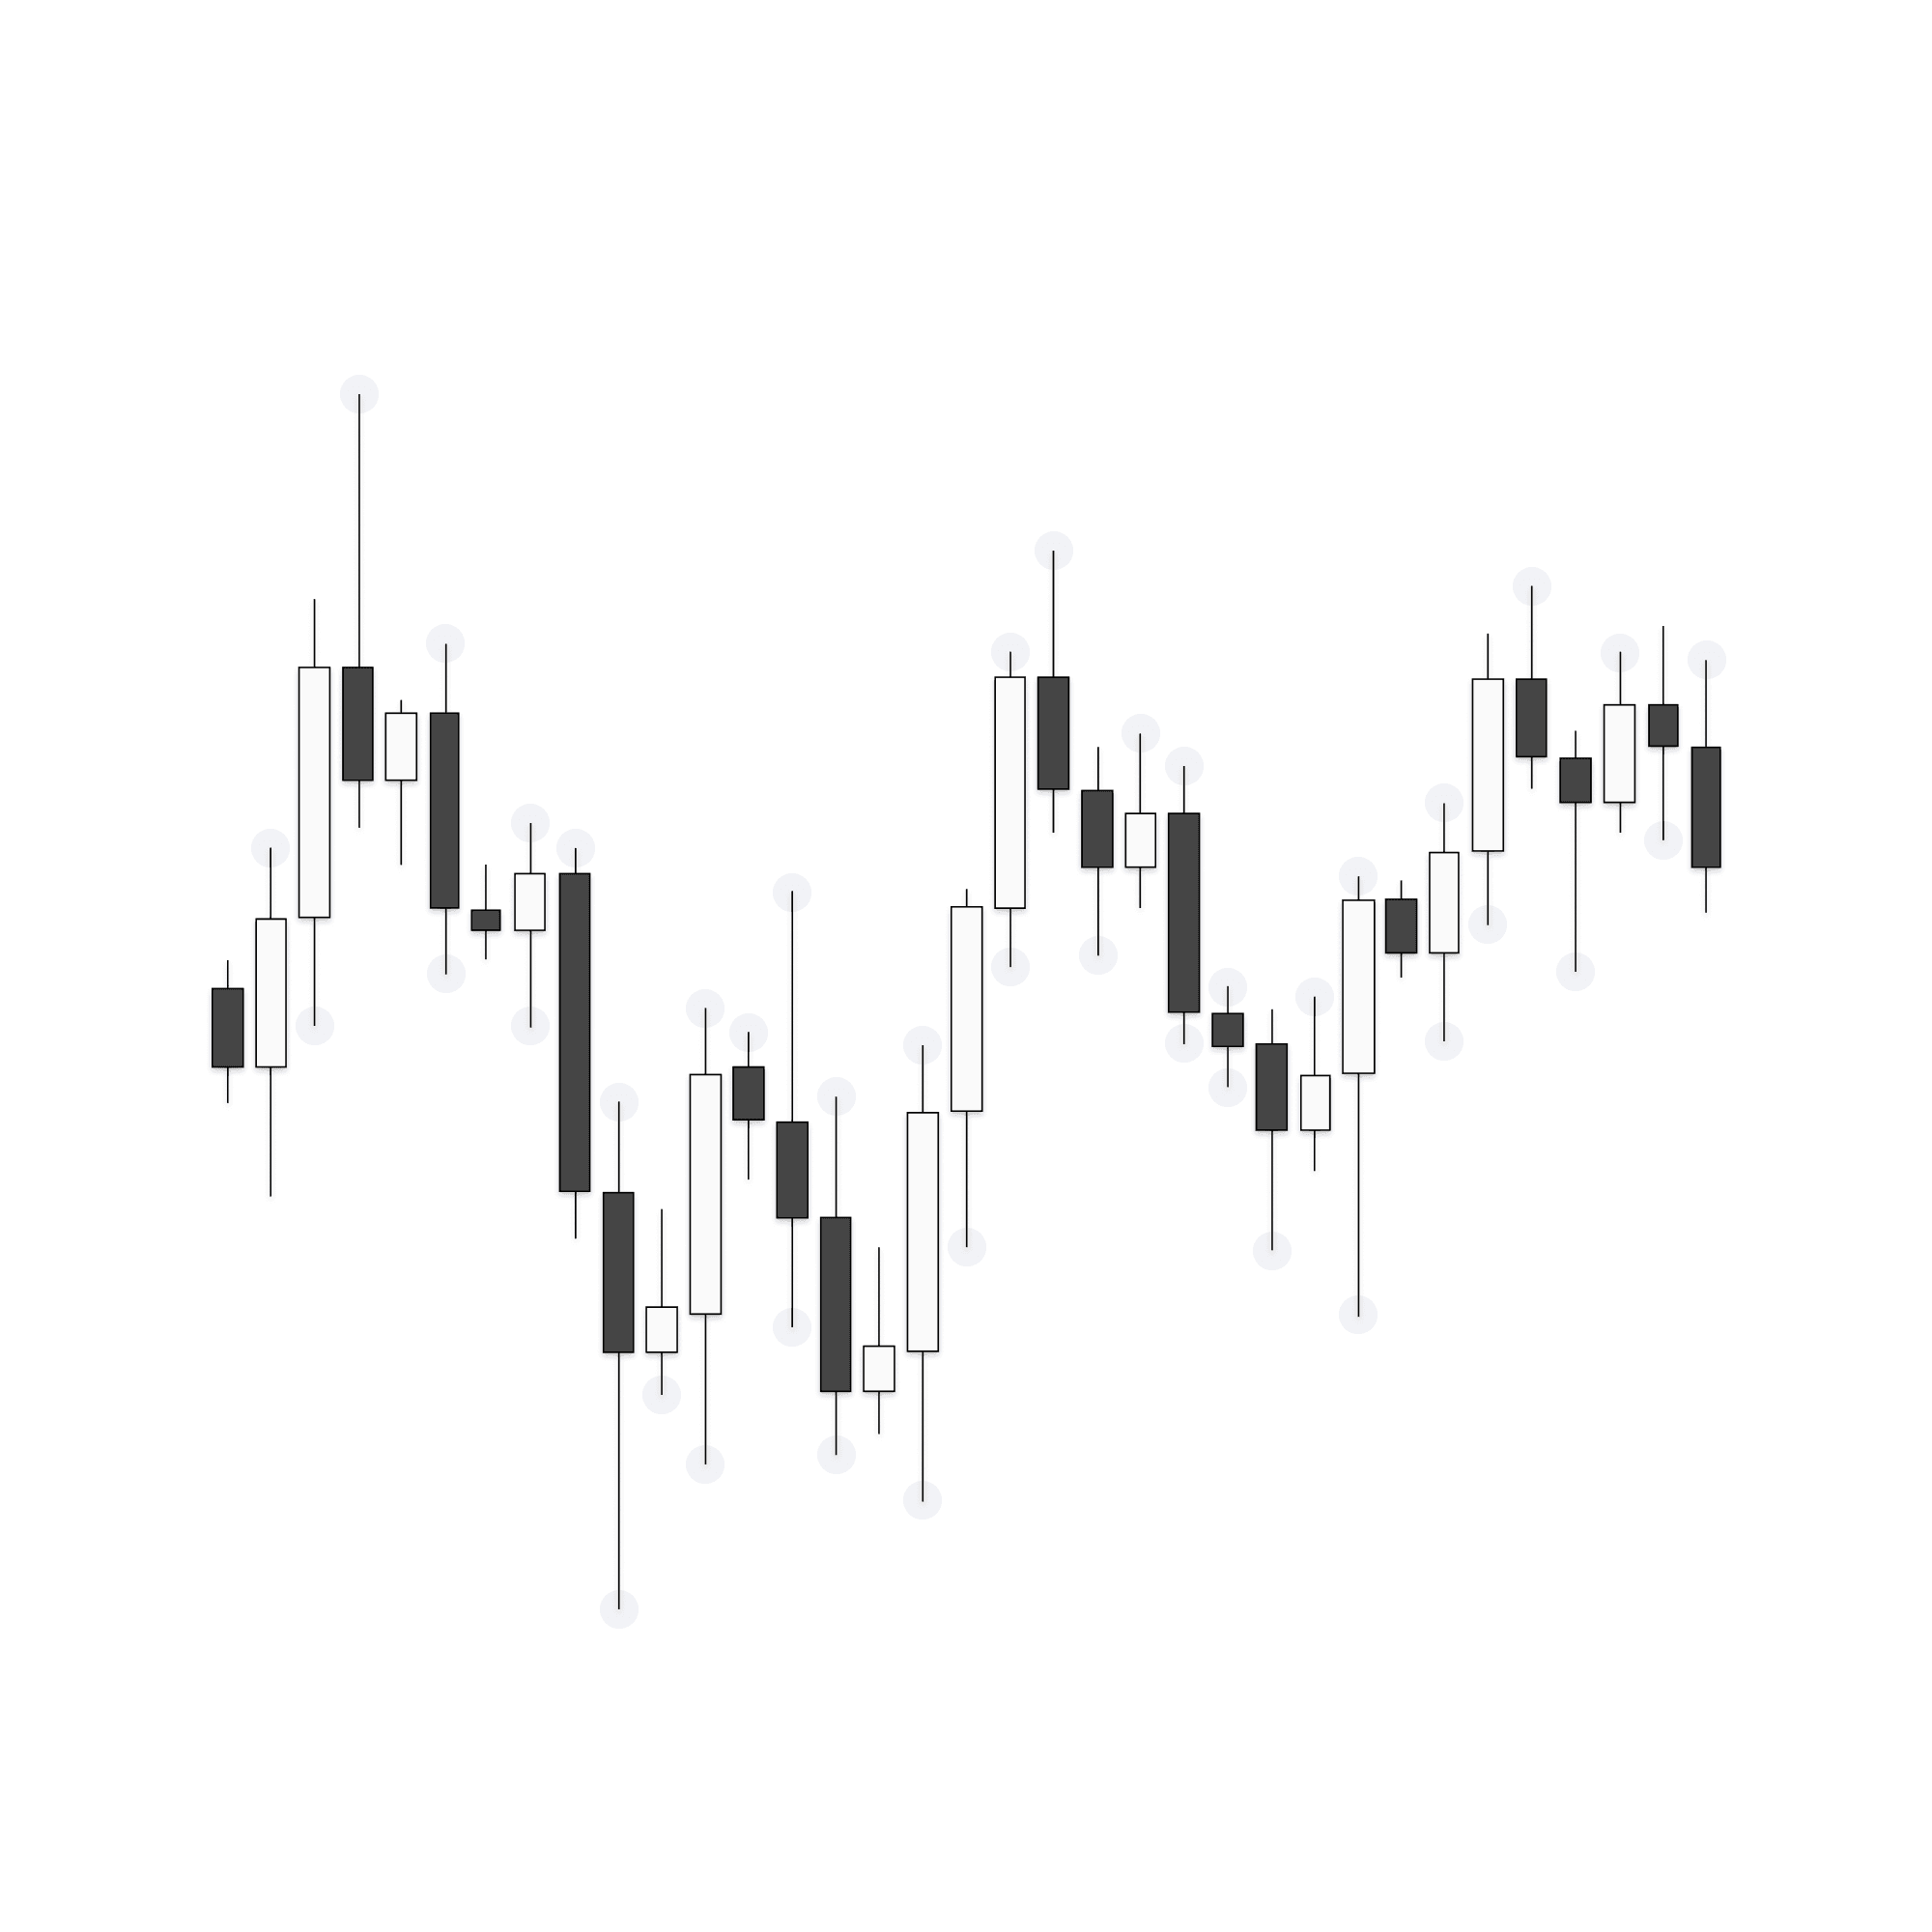
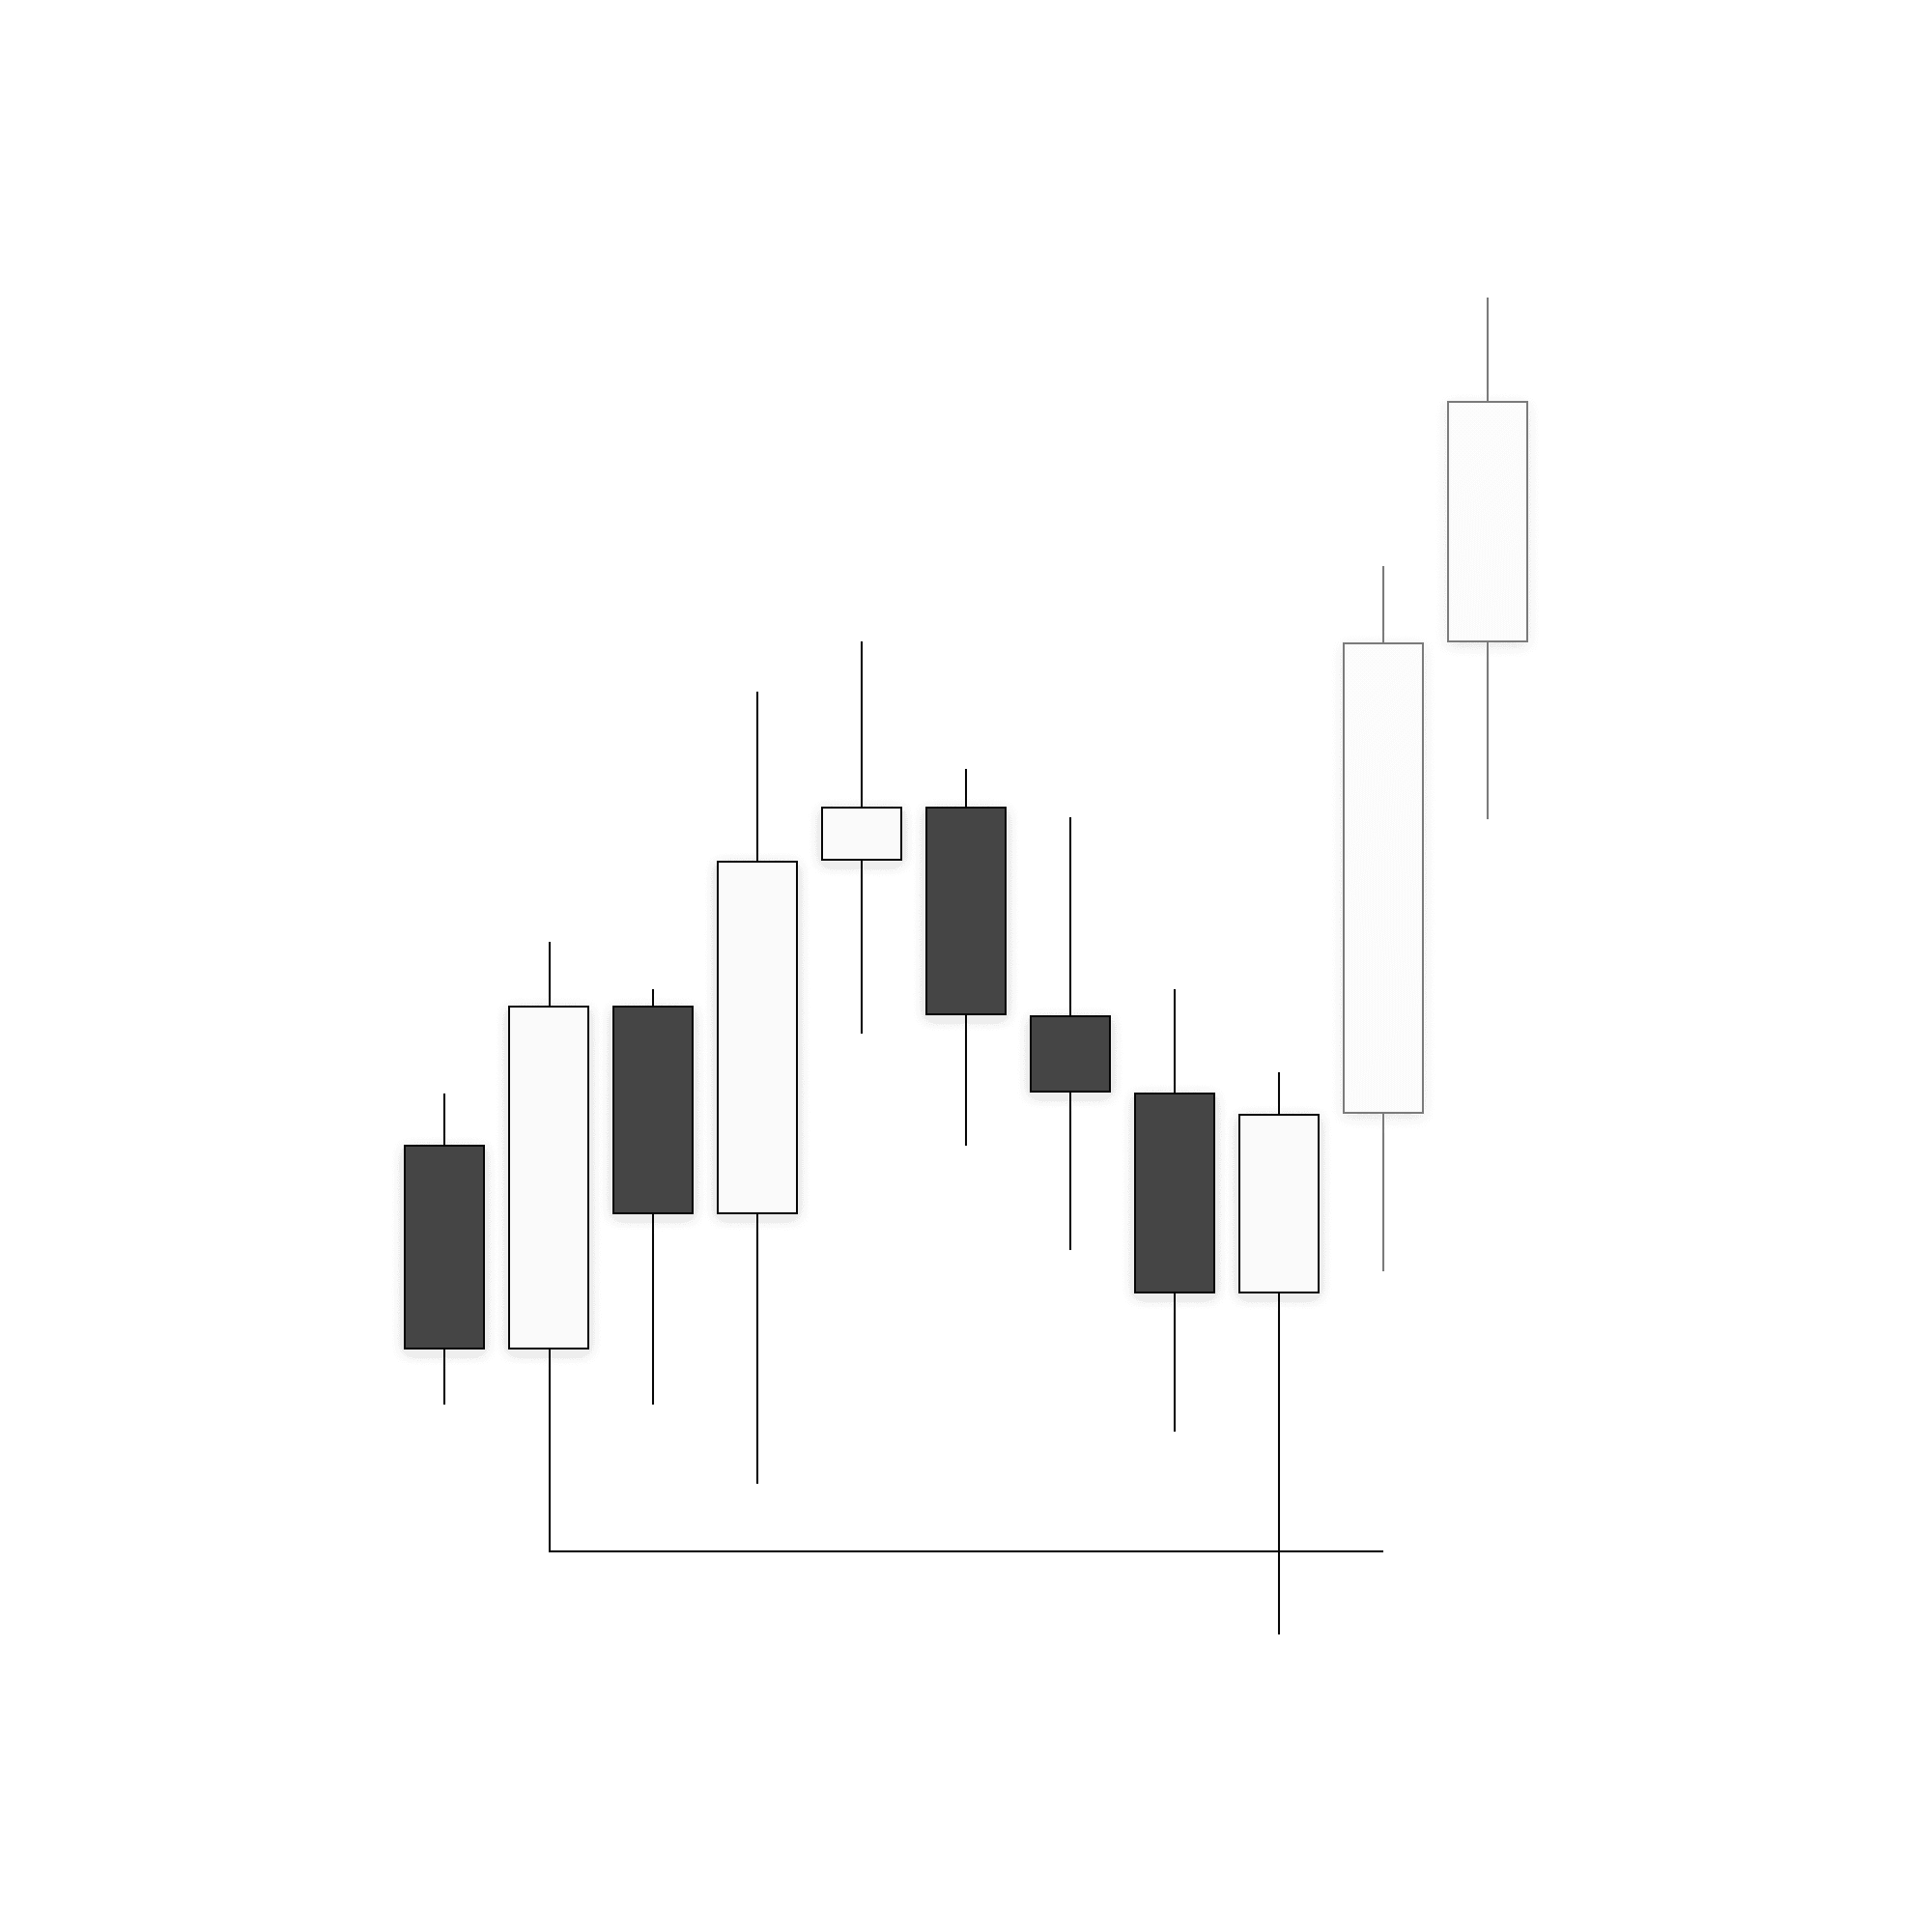
Below is a real daily chart example. With only a few lines on the chart, price action can be clearly navigated through. Use your new understanding of failure swings and relevant swings to build experience from this example.
After reviewing this lesson and the related YouTube video multiple times, you should bring the logic into your own daily chart and start to apply the steps to build experience. Both practicing on static charts and watching the development in a live market help solidify the use of relevant swings in your system.
Prop
Learn
Explore mentorship with

AM and

TTrades
The standard of trading guidance
Prop
Learn
Get funded with the prop
firms I trade with
Use code AM for the best discount
Watch on YouTube
The Problem and the Solution
Every high quality trade begins with higher timeframe framework. Without it, execution becomes reactive and bias shifts with every short-term price move. Many traders assume building framework requires mastering complex concepts, yet the reality is far more simple. It begins with identifying highs and lows correctly and understanding which ones truly hold weight in the market.
Within my system, every trade is built on what I define as relevant swings. This concept is part of each decision I make. Relevant swings define where opportunity exists, which side of the market to focus on, and when the market is structured to expand. When applied properly, they eliminate unnecessary noise in the charts and anchor bias to objective extremes.
This lesson will break down the exact three-step process used inside my framework to identify and use daily relevant swings with consistency.
The Real Objective of Relevant Swings
The goal of identifying relevant swings is not only to mark highs and lows. It is to remove doubt. Most traders clutter their charts with session highs and lows, opening ranges, and levels pulled from multiple timeframes. The result is always confusion and conflicting signals.
Relevant swings simplify this process by focusing only on extremes relative to the current market range. When price reaches an extreme and reacts, that reaction carries weight without any doubt. It is meaningful because it occurs at the outer boundary of the active range. Anything that is not an extreme becomes secondary and often irrelevant.
By focusing on extremes and filtering out internal noise, we gain clarity. That clarity becomes the basis for our framework.
Step One: Understanding Failure Swings
The first concept you must understand is the failure swing. This is the most important principle in identifying relevant highs and lows.
A failure swing occurs when price sets an initial high or low, then makes deep runs back into that level without running it out. If a low forms and price genuinely intends to reverse, it should expand away and retrace shallowly. When price repeatedly returns deep into that same level, it signals a lack of commitment to reversal. Those deep returns are failure swings.
Failure swings are not the extremes. They are evidence that the extreme sits elsewhere. When you identify an initial high or low and then observe deep runs back into it, you ignore the internal reactions and focus on the original extreme that price continues to reference.
Step Two: Valid Price Separation
Once you understand failure swings, the next step is evaluating separation between potential extremes.
On a daily chart, you may identify multiple highs or lows that appear relevant. The question becomes whether they are truly independent extremes or simply nested inside one another. This is where price separation becomes critical.
Valid separation exists when engaging one potential relevant swing would not automatically create a failure swing relative to another nearby level. If price can react at one low without forming a deep run into another low to its left, then those two lows are structurally separate. Both may qualify as relevant swings.
Invalid separation occurs when engaging one level would immediately create a failure swing into another nearby level. In that case, the first level is not truly independent. The deeper extreme is the only relevant swing.
This concept prevents traders from over marking levels and reacting to points that do not carry structural weight. Valid separation ensures that when price reacts at a level, that reaction is meaningful and not structurally compromised.
Step Three: The 30-Day Lookback Period
The final step is defining your lookback range. Without limits, traders begin referencing highs and lows from months or even years ago, diluting relevance for intraday execution.
Inside my framework, I use a fixed 30 daily candle lookback period. Not 30 calendar days, but 30 completed daily candles. Anything beyond that range is excluded from consideration.
This constraint forces focus on recent market development. It keeps framework fluid and responsive to current conditions. Since we are day trading and holding trades for minutes to hours, our higher timeframe bias must reflect recent structural extremes, not distant historical levels. The 30 candle lookback creates clarity and prevents overanalysis.
In your TradingView chart, hover your cursor over the current daily candle. Then hold Shift, left click your mouse, and drag left until you see the bar counter show 30. This is the fastest way to determine this range in your charts.
How Reactions at Relevant Swings Create Bias
Identifying relevant swings is only the beginning. The actionable step comes from observing how price reacts when those extremes are engaged.
There are two primary reactions that matter. The first is manipulation. This occurs when price trades into a relevant high or low and closes back into the range. That reaction signals rejection at an extreme and often sets the stage for expansion in the opposite direction.
The second is decisive closure through a relevant swing. When price closes strongly beyond a relevant high or low, it signals continuation and expansion in that direction.
Because these reactions occur at extremes, they carry structural authority. A manipulation at a relevant low creates a bullish bias until price reaches an opposing relevant high. A decisive close through a relevant high reinforces continuation.
This is how daily framework translates into intraday opportunity.
Real Chart Example and Practicing
Below is a real daily chart example. With only a few lines on the chart, price action can be clearly navigated through. Use your new understanding of failure swings and relevant swings to build experience from this example.
After reviewing this lesson and the related YouTube video multiple times, you should bring the logic into your own daily chart and start to apply the steps to build experience. Both practicing on static charts and watching the development in a live market help solidify the use of relevant swings in your system.
The Problem and the Solution
Every high quality trade begins with higher timeframe framework. Without it, execution becomes reactive and bias shifts with every short-term price move. Many traders assume building framework requires mastering complex concepts, yet the reality is far more simple. It begins with identifying highs and lows correctly and understanding which ones truly hold weight in the market.
Within my system, every trade is built on what I define as relevant swings. This concept is part of each decision I make. Relevant swings define where opportunity exists, which side of the market to focus on, and when the market is structured to expand. When applied properly, they eliminate unnecessary noise in the charts and anchor bias to objective extremes.
This lesson will break down the exact three-step process used inside my framework to identify and use daily relevant swings with consistency.
The Real Objective of Relevant Swings
The goal of identifying relevant swings is not only to mark highs and lows. It is to remove doubt. Most traders clutter their charts with session highs and lows, opening ranges, and levels pulled from multiple timeframes. The result is always confusion and conflicting signals.
Relevant swings simplify this process by focusing only on extremes relative to the current market range. When price reaches an extreme and reacts, that reaction carries weight without any doubt. It is meaningful because it occurs at the outer boundary of the active range. Anything that is not an extreme becomes secondary and often irrelevant.
By focusing on extremes and filtering out internal noise, we gain clarity. That clarity becomes the basis for our framework.
Step One: Understanding Failure Swings
The first concept you must understand is the failure swing. This is the most important principle in identifying relevant highs and lows.
A failure swing occurs when price sets an initial high or low, then makes deep runs back into that level without running it out. If a low forms and price genuinely intends to reverse, it should expand away and retrace shallowly. When price repeatedly returns deep into that same level, it signals a lack of commitment to reversal. Those deep returns are failure swings.
Failure swings are not the extremes. They are evidence that the extreme sits elsewhere. When you identify an initial high or low and then observe deep runs back into it, you ignore the internal reactions and focus on the original extreme that price continues to reference.
Step Two: Valid Price Separation
Once you understand failure swings, the next step is evaluating separation between potential extremes.
On a daily chart, you may identify multiple highs or lows that appear relevant. The question becomes whether they are truly independent extremes or simply nested inside one another. This is where price separation becomes critical.
Valid separation exists when engaging one potential relevant swing would not automatically create a failure swing relative to another nearby level. If price can react at one low without forming a deep run into another low to its left, then those two lows are structurally separate. Both may qualify as relevant swings.
Invalid separation occurs when engaging one level would immediately create a failure swing into another nearby level. In that case, the first level is not truly independent. The deeper extreme is the only relevant swing.
This concept prevents traders from over marking levels and reacting to points that do not carry structural weight. Valid separation ensures that when price reacts at a level, that reaction is meaningful and not structurally compromised.
Step Three: The 30-Day Lookback Period
The final step is defining your lookback range. Without limits, traders begin referencing highs and lows from months or even years ago, diluting relevance for intraday execution.
Inside my framework, I use a fixed 30 daily candle lookback period. Not 30 calendar days, but 30 completed daily candles. Anything beyond that range is excluded from consideration.
This constraint forces focus on recent market development. It keeps framework fluid and responsive to current conditions. Since we are day trading and holding trades for minutes to hours, our higher timeframe bias must reflect recent structural extremes, not distant historical levels. The 30 candle lookback creates clarity and prevents overanalysis.
In your TradingView chart, hover your cursor over the current daily candle. Then hold Shift, left click your mouse, and drag left until you see the bar counter show 30. This is the fastest way to determine this range in your charts.
How Reactions at Relevant Swings Create Bias
Identifying relevant swings is only the beginning. The actionable step comes from observing how price reacts when those extremes are engaged.
There are two primary reactions that matter. The first is manipulation. This occurs when price trades into a relevant high or low and closes back into the range. That reaction signals rejection at an extreme and often sets the stage for expansion in the opposite direction.
The second is decisive closure through a relevant swing. When price closes strongly beyond a relevant high or low, it signals continuation and expansion in that direction.
Because these reactions occur at extremes, they carry structural authority. A manipulation at a relevant low creates a bullish bias until price reaches an opposing relevant high. A decisive close through a relevant high reinforces continuation.
This is how daily framework translates into intraday opportunity.
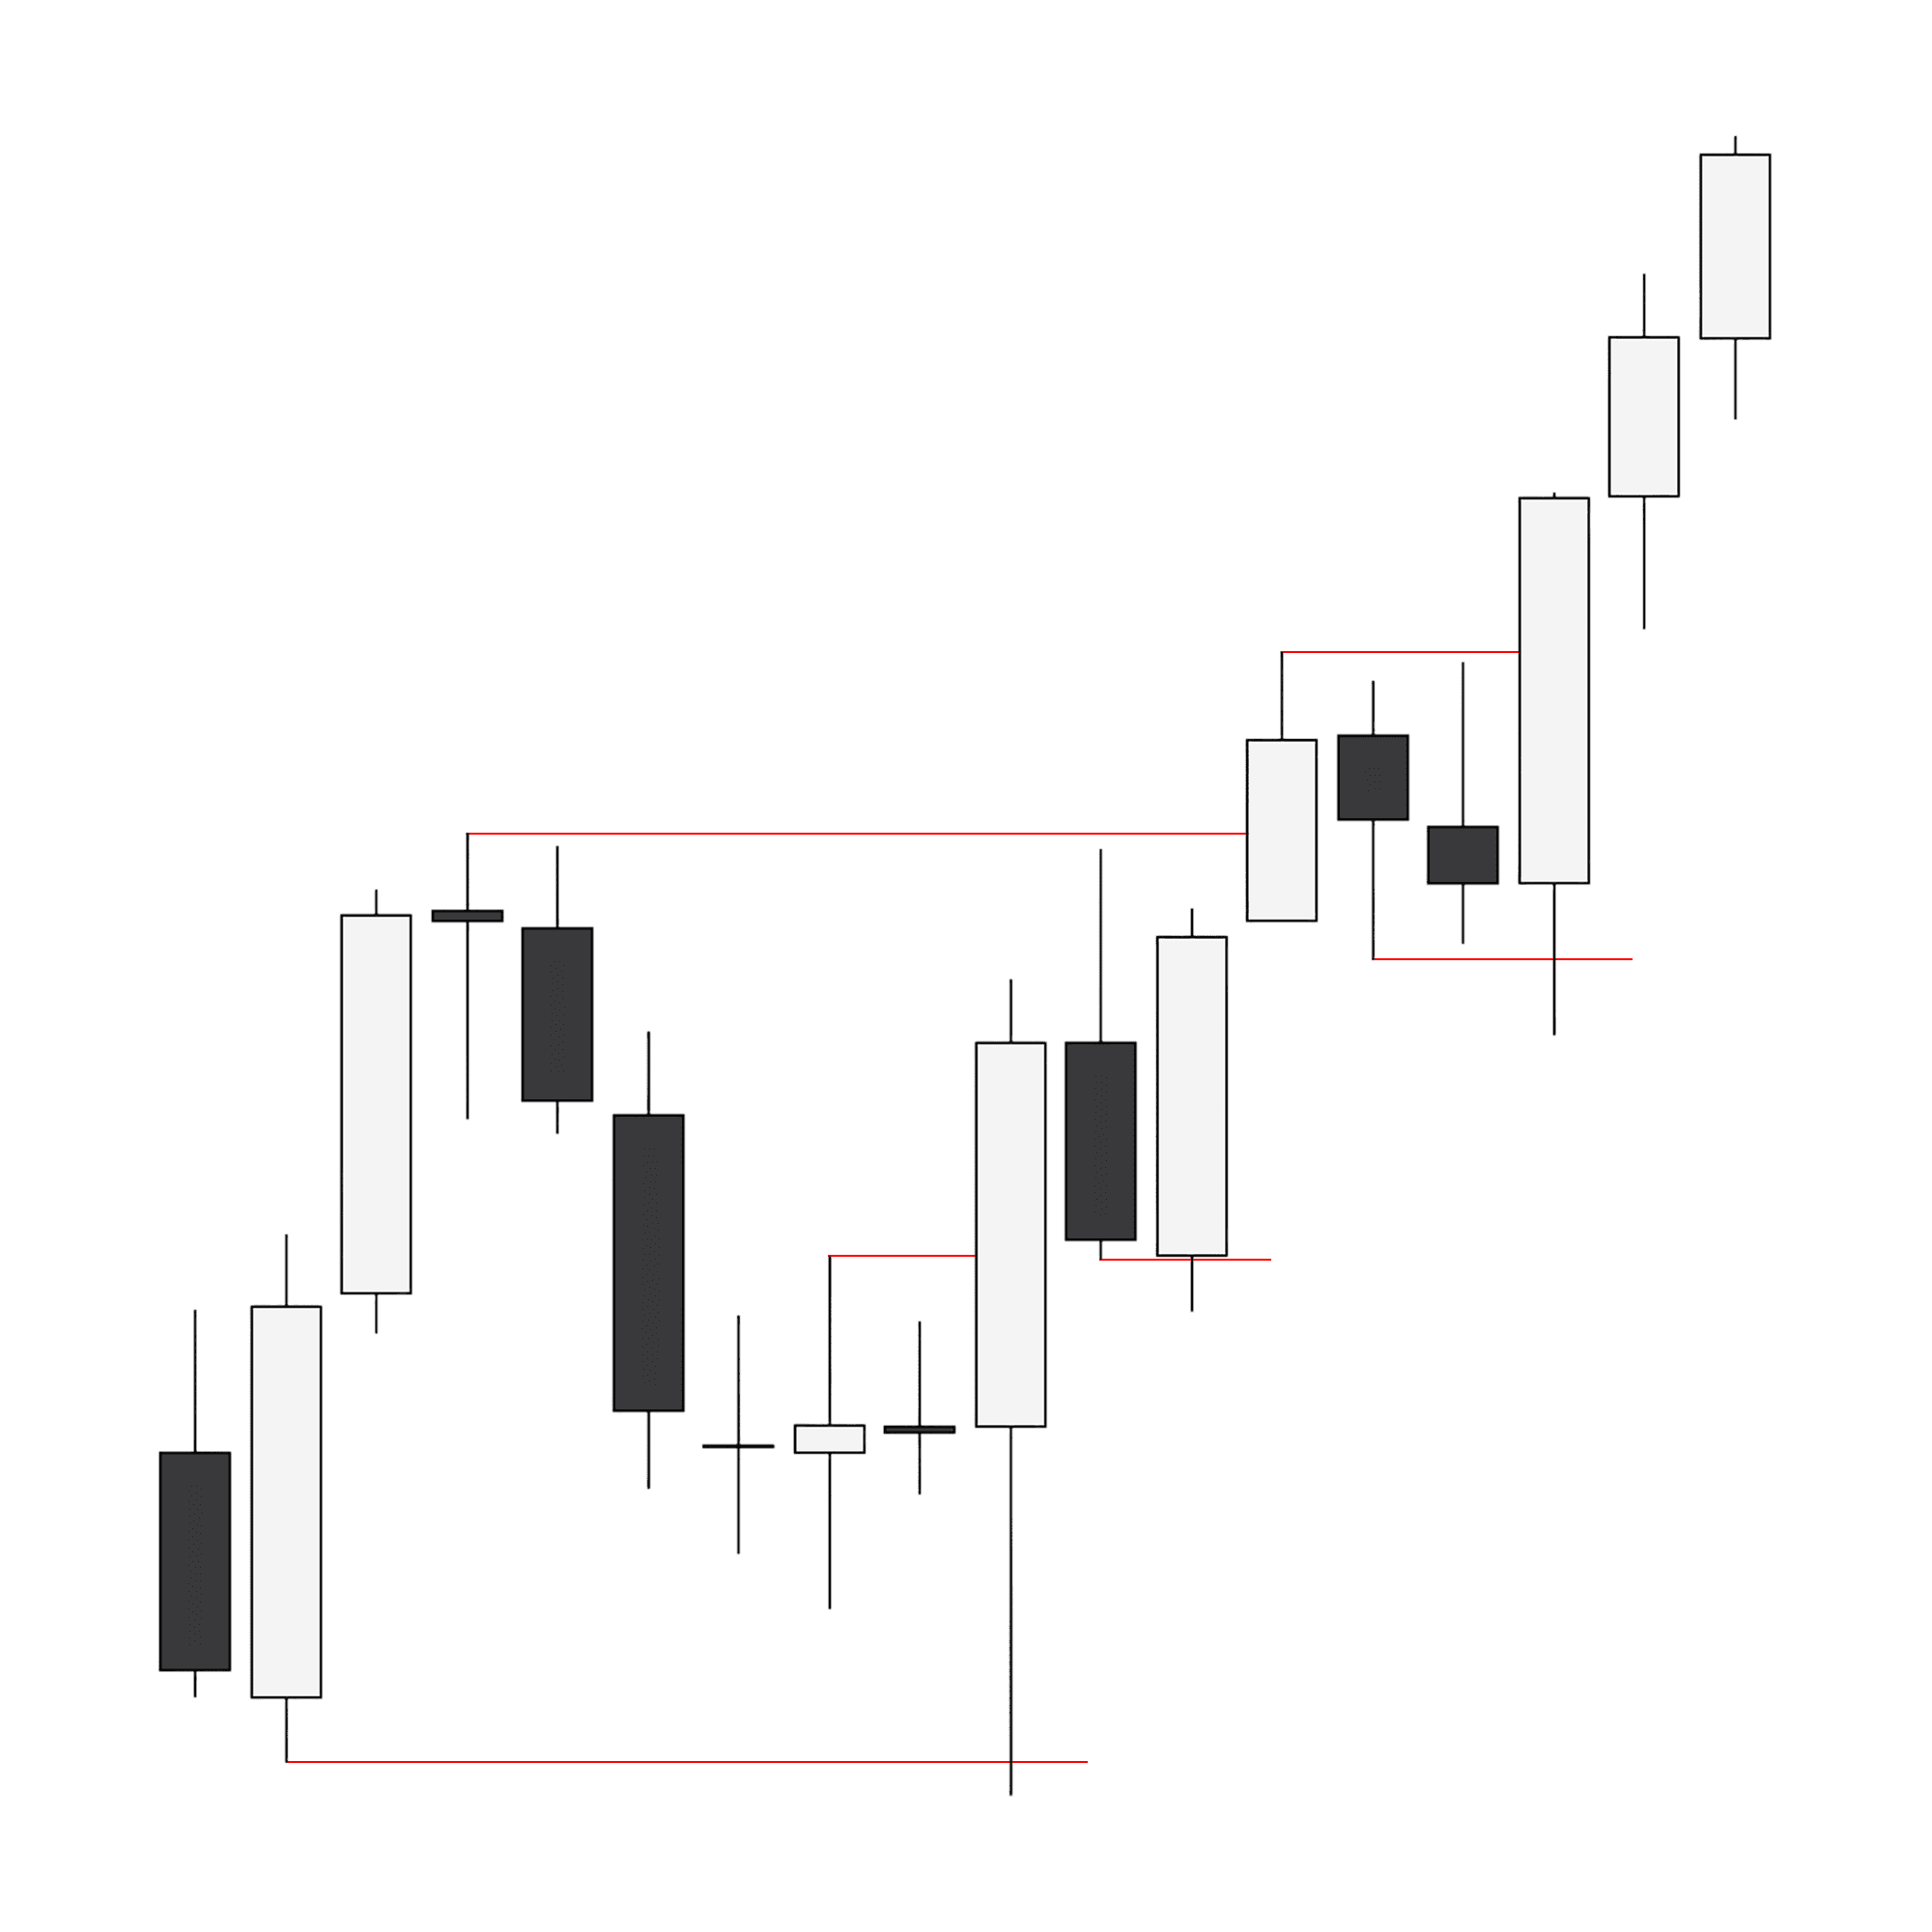
Real Chart Example and Practicing
Below is a real daily chart example. With only a few lines on the chart, price action can be clearly navigated through. Use your new understanding of failure swings and relevant swings to build experience from this example.
After reviewing this lesson and the related YouTube video multiple times, you should bring the logic into your own daily chart and start to apply the steps to build experience. Both practicing on static charts and watching the development in a live market help solidify the use of relevant swings in your system.
Prop
Learn
Get funded with the prop firms I trade with
Use code AM for the best discount


Prop
Learn
Explore mentorship with
AM and
TTrades

Prop
Learn
Get funded with the prop firms I trade with
Use code AM for the best discount
Prop
Learn
Explore mentorship with
AM and
TTrades
Prop
Learn
Explore mentorship with
AM and
TTrades
The standard of trading guidance
Prop
Learn
Get funded with the prop
firms I trade with
Use code AM for the best discount
Prop
Learn
Explore mentorship with
AM and
TTrades
The standard of trading guidance
Prop
Learn
Get funded with the prop
firms I trade with
Use code AM for the best discount

Introduction to Relevant Swings for Daily Bias
Continue Learning.


© 2026 AM Trades. All Rights Reserved.
© 2026 AM Trades. All Rights Reserved.


© 2026 AM Trades. All Rights Reserved.