


The 4 Steps Behind My Trading System
Model
The 4 Steps Behind My Trading System
This lesson breaks down the four-step trading process I follow on every trade: framework, confirmation, entry, and management. You will learn how higher timeframe structure translates into intraday opportunity and how confirmation turns bias into execution. The focus is on building a repeatable system that controls risk while maximizing upside.
An Overview of the Steps
Traders often struggle because they lack a structured approach to the markets. Without a defined process, bias constantly shifts, entries become reactive, and management turns emotional. A real system must control direction, execution, and risk from start to finish.
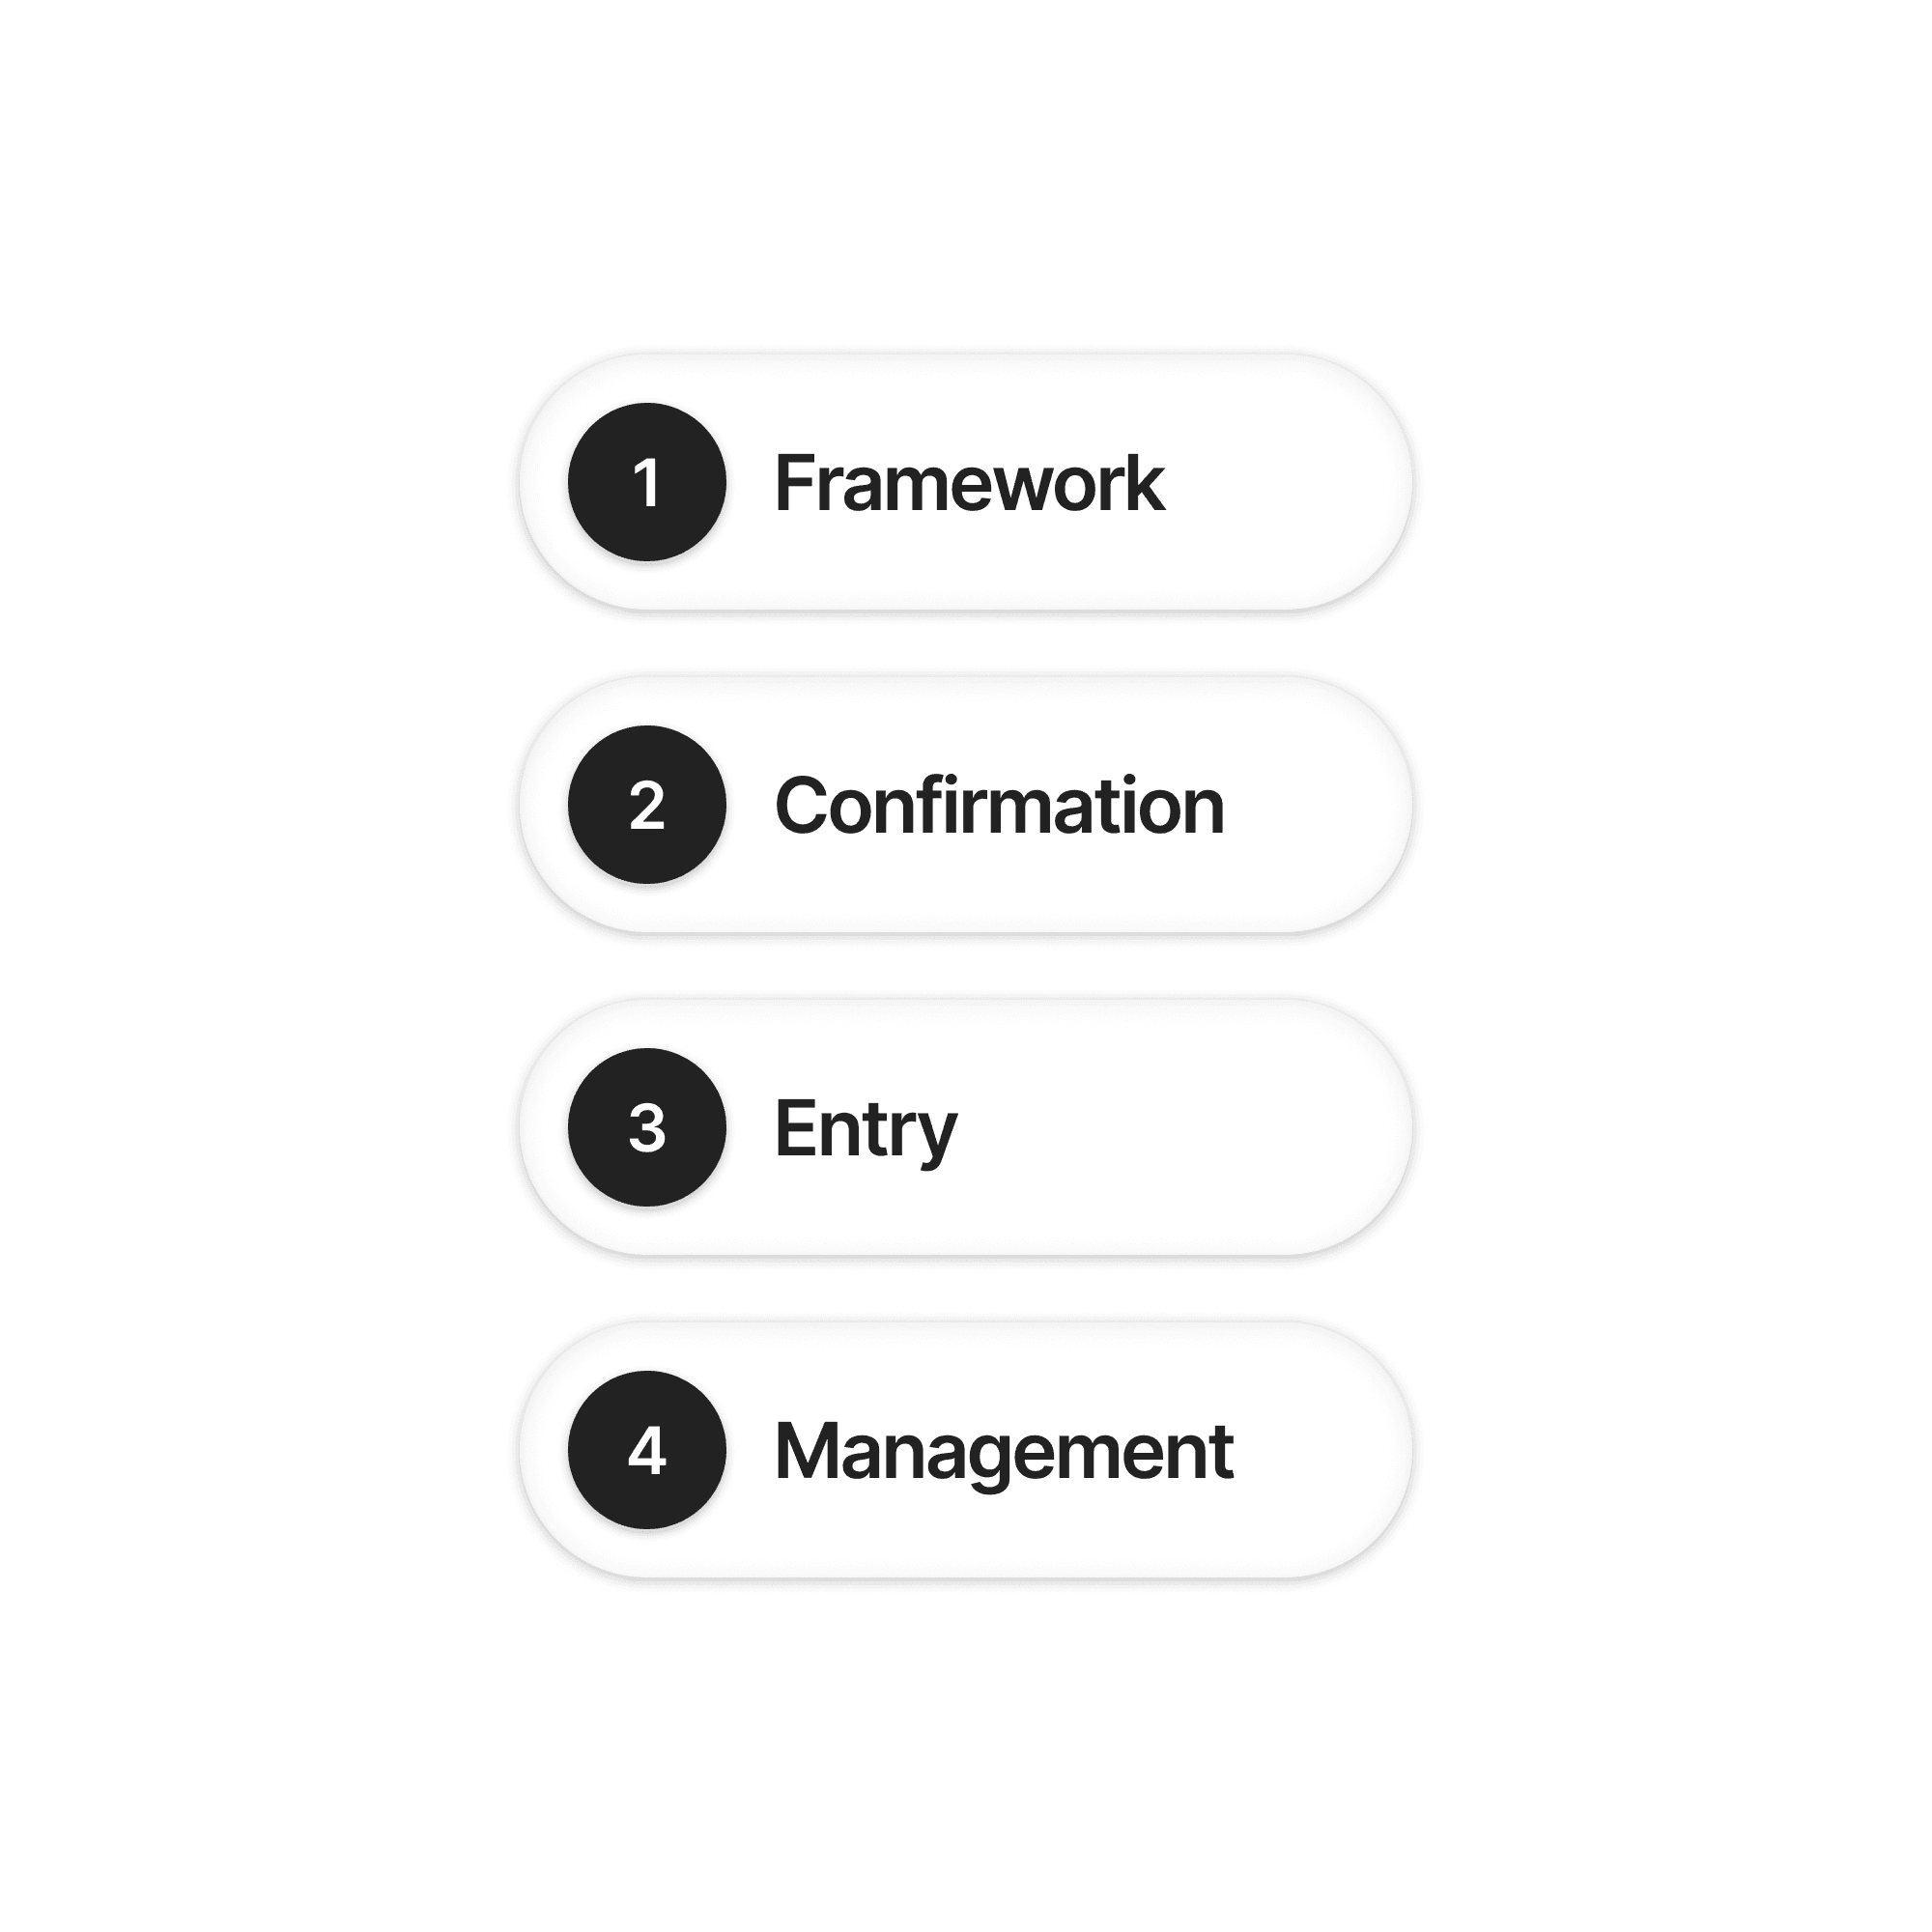
Every trade I take follows four specific steps of framework, confirmation, entry, and management. This is a layered approach designed to align higher timeframes with intraday confirmation while protecting downside risk. Each step has a defined purpose. When applied together, they create consistency and remove unnecessary decision making.
This article breaks down exactly how the process works and how each step builds on the one before it.
Step One: Framework
Framework establishes directional bias for the trading day where we focus on one side and filter out the rest. It is built using the daily timeframe, not the weekly or hourly charts.
The weekly and monthly charts are too broad for short-term trading. An assumption formed on those timeframes can remain unresolved for extended periods, which conflicts with an intraday approach. Lower timeframes provide too much detail and often distract from the larger objective. The daily chart provides balance. It offers enough clarity while allowing for adjustment to the development day by day.
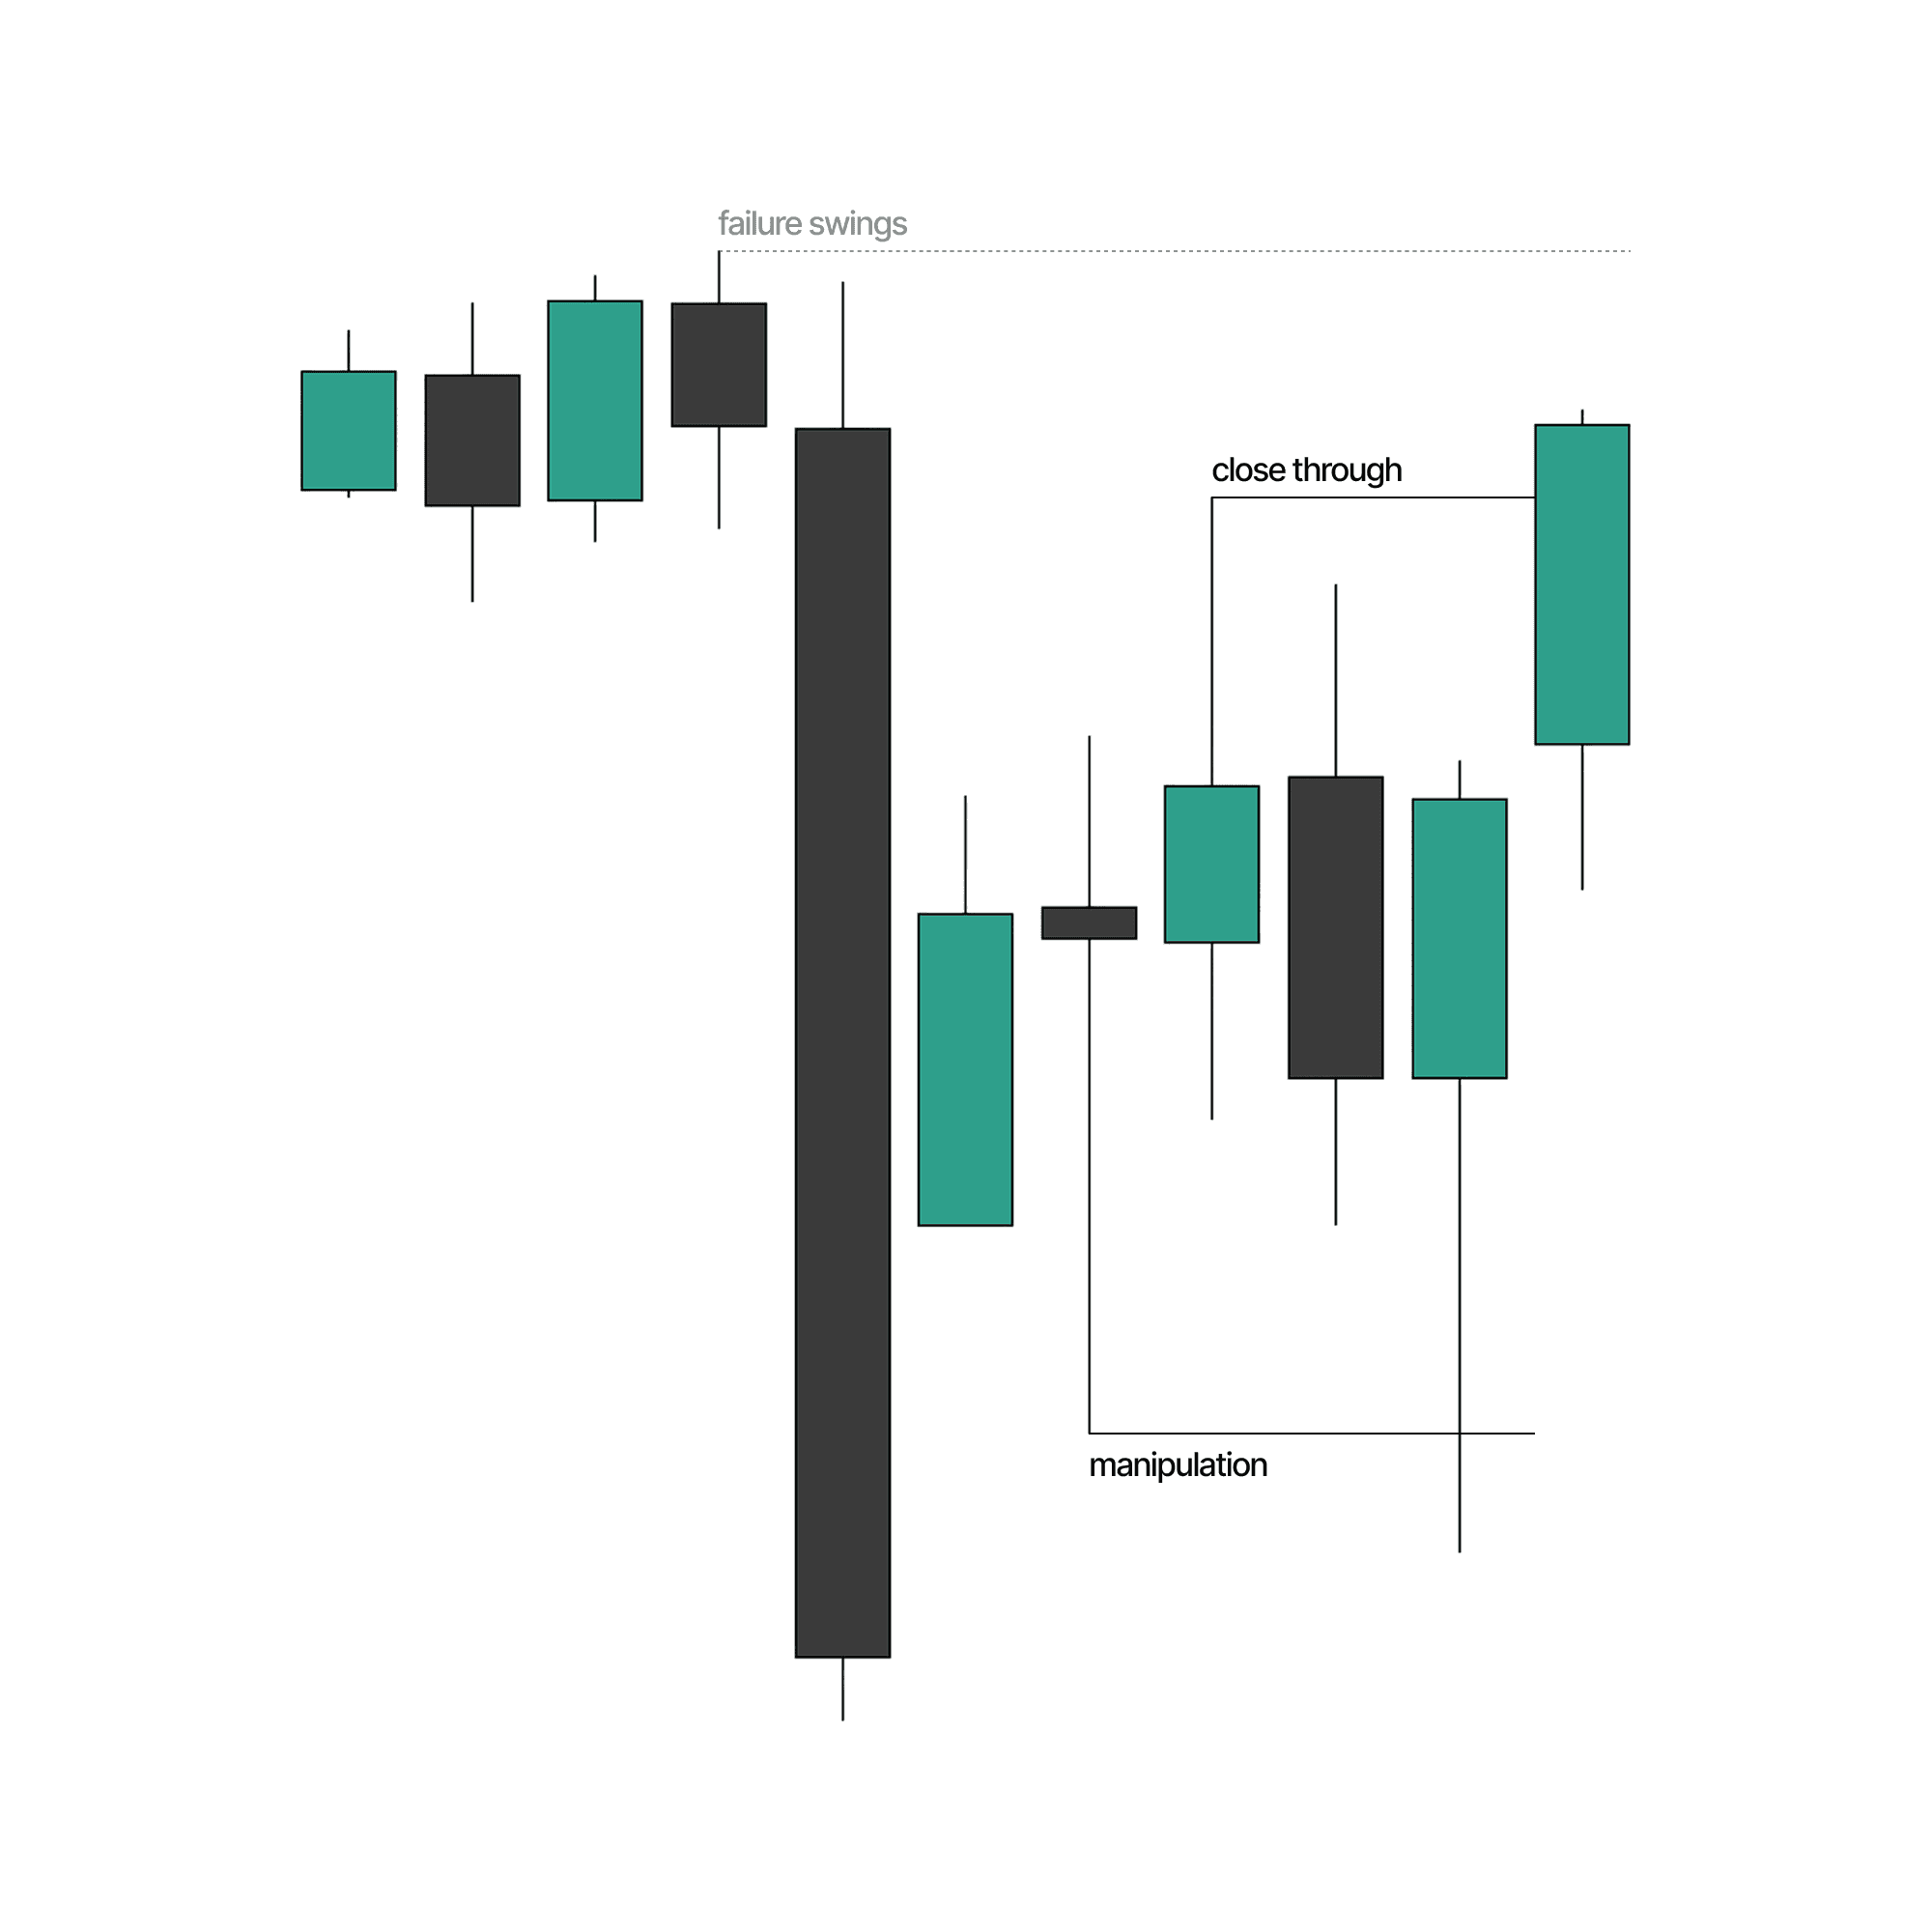
Inside my system, daily framework begins by identifying relevant highs and lows at the extremes of price. These extremes are determined using the understanding of failure swings, price separation, and a defined lookback period. When price engages a true extreme, we know the reaction carries weight.
There are two reactions that matter at these levels. A manipulation, where price trades into a level and closes back within range which suggests a reversal. A deep close through a level signals continuation. From this, an expectation is formed for the following day.
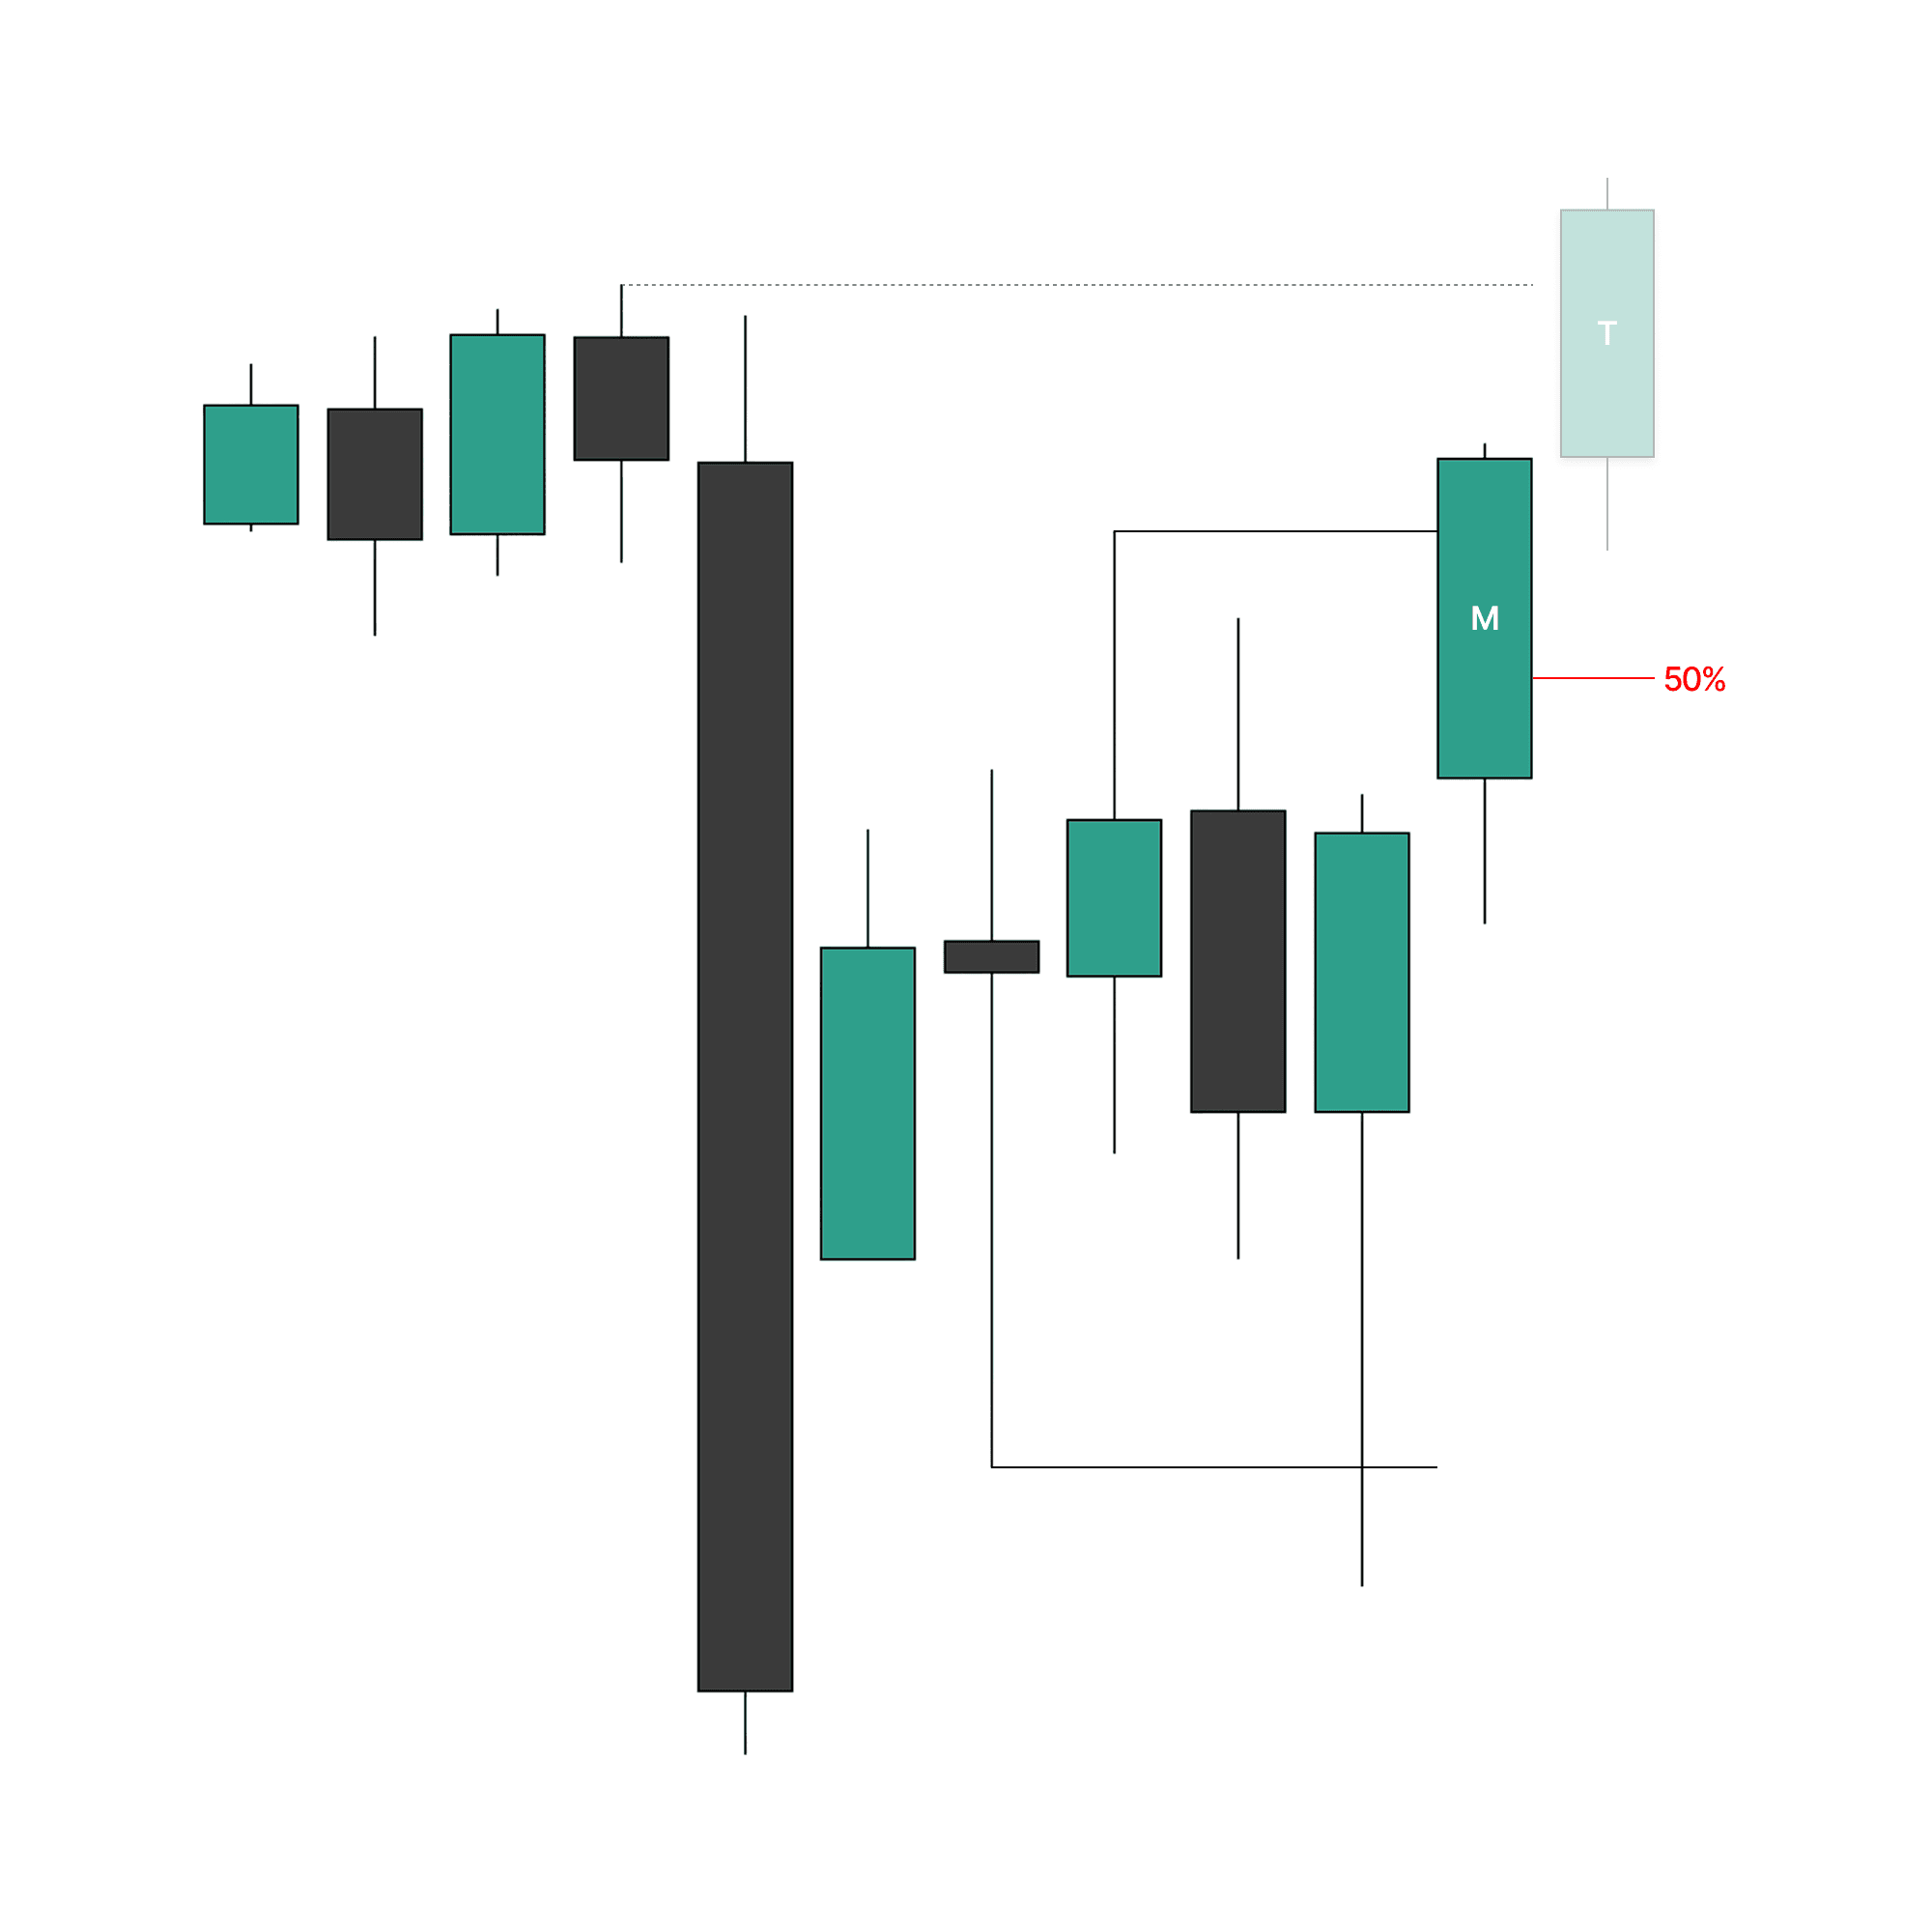
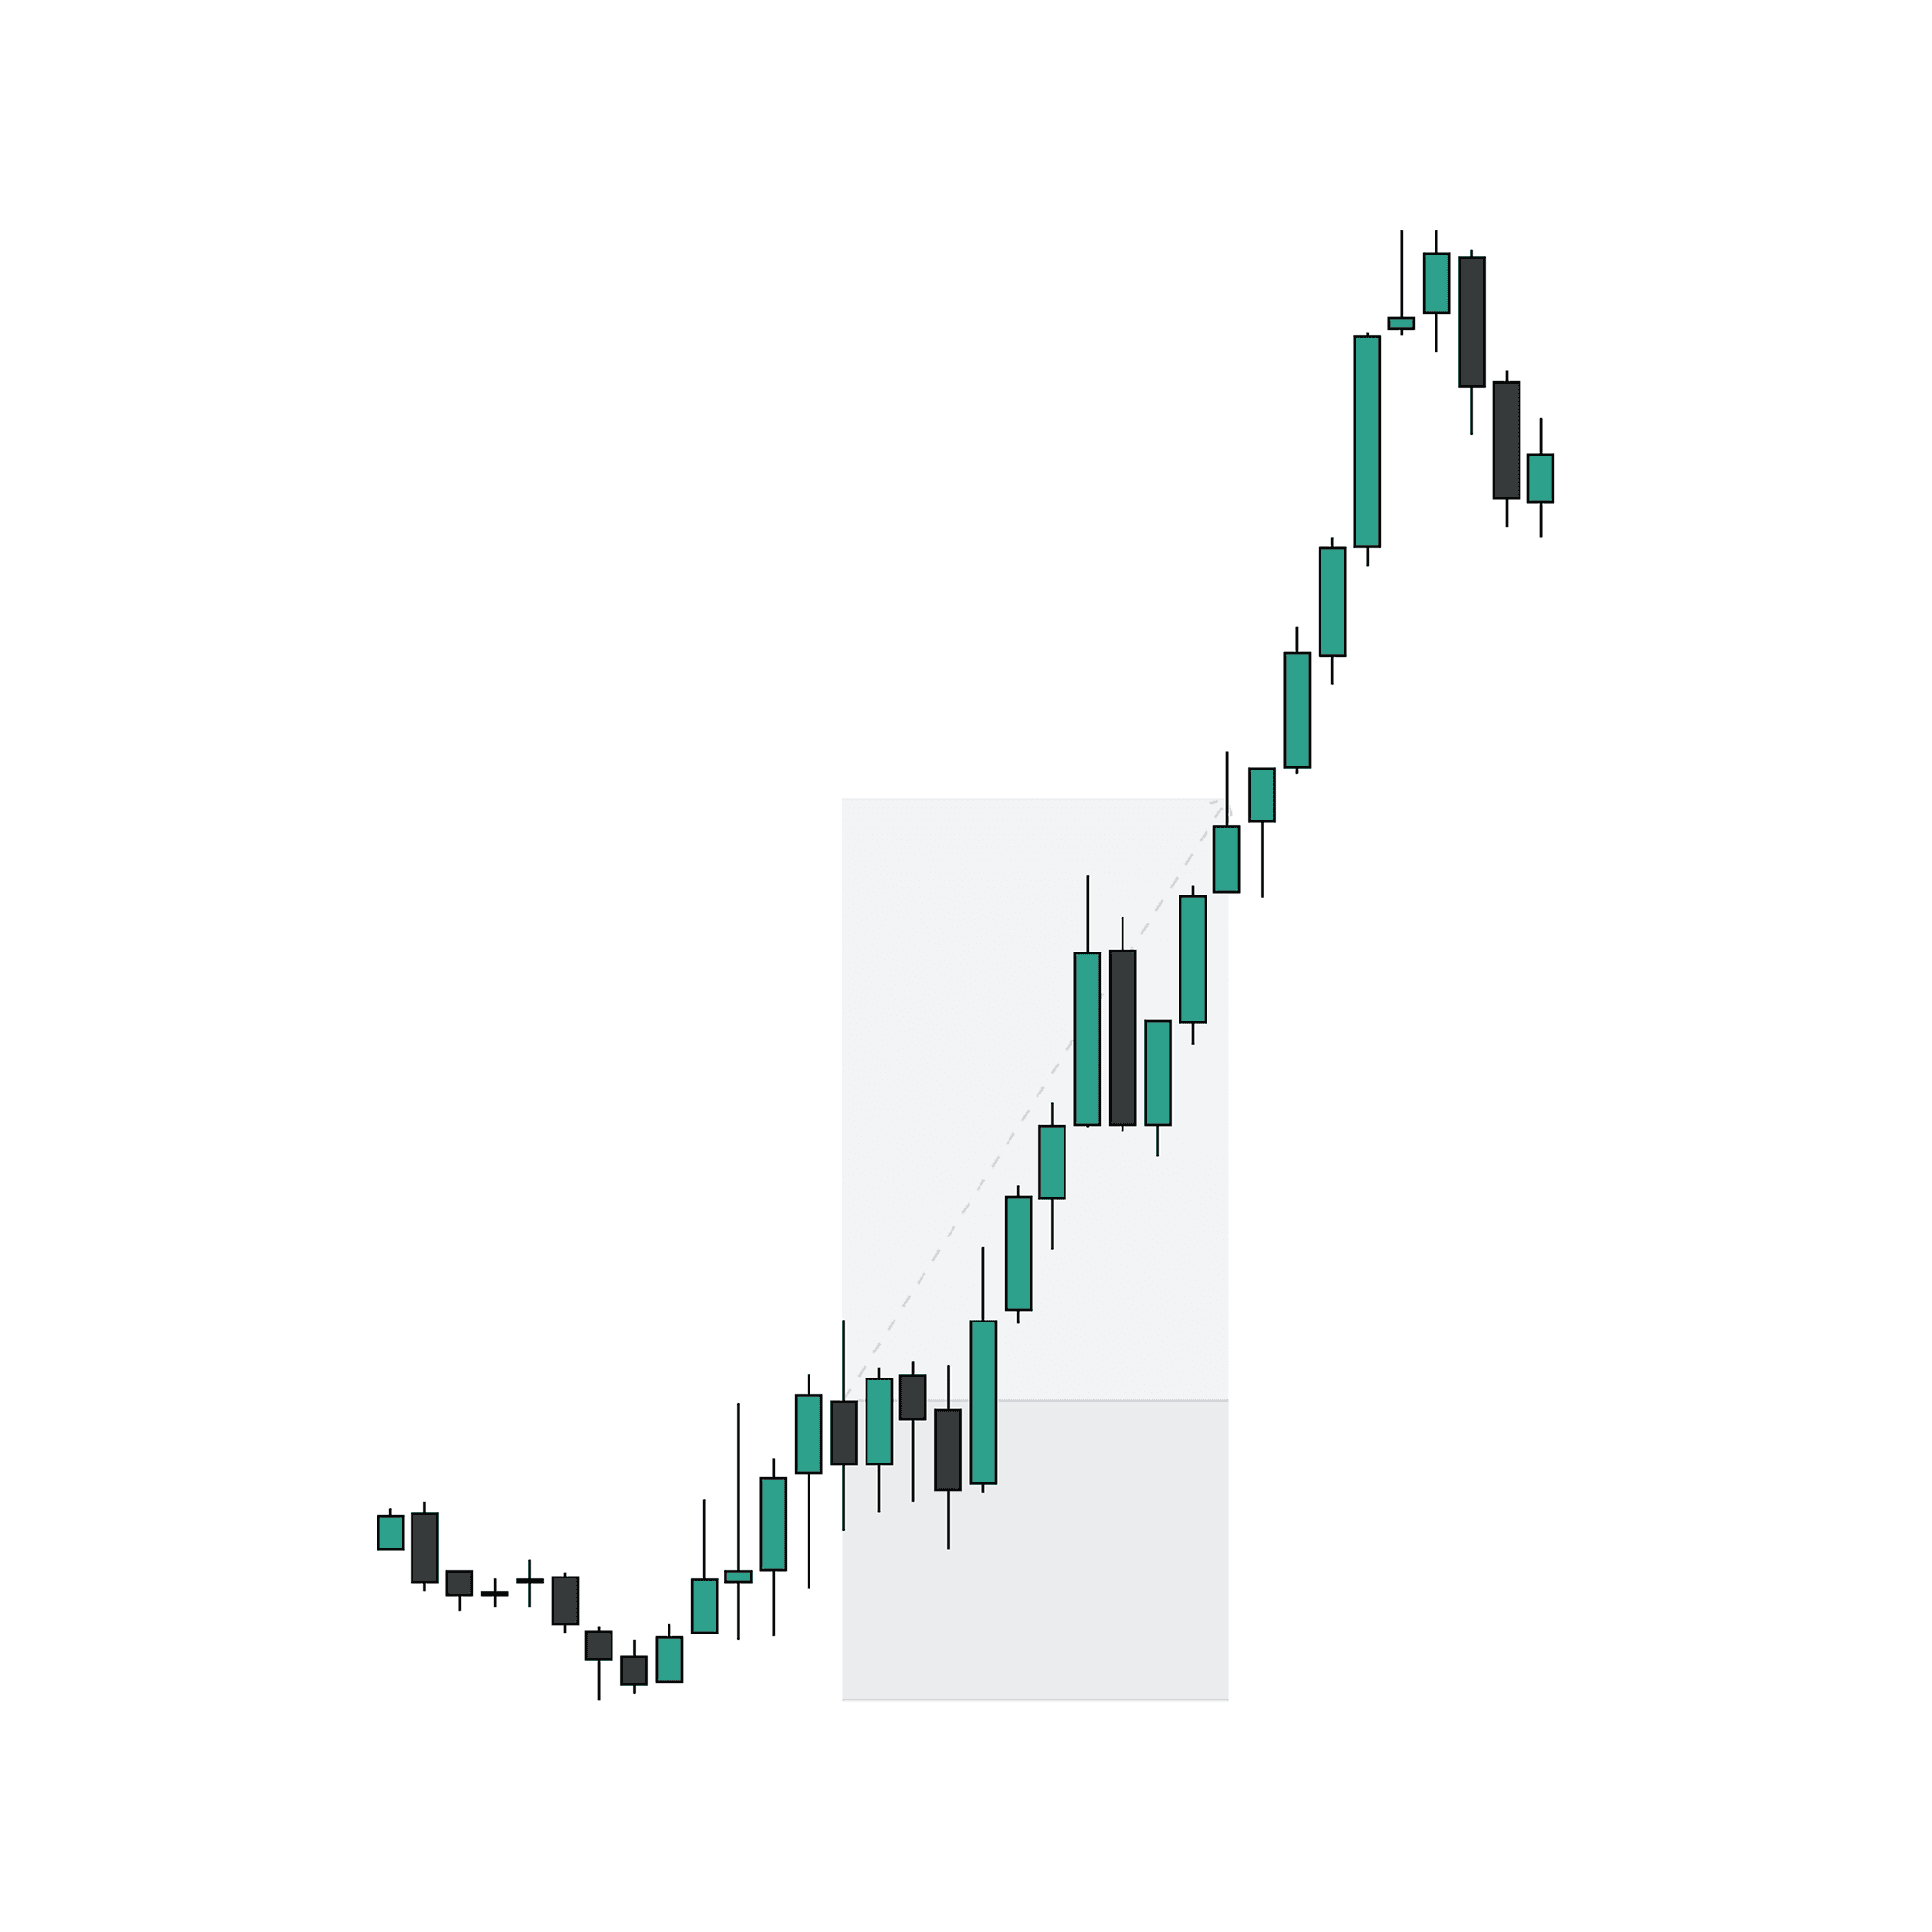
Below we have a one-sided framework in the market using relevant swing logic on the daily. Off the lows is a valid manipulation which establishes the initial reversal. The following day expands away from the low and has a deep close through the relevant high to the left. These reactions create the assumption that the next daily candle will continue to the failure swings above which act as the draw on price.
Additional logic can be added to the framework. The weekly profile can be utilized to understand that when Monday reverses, Tuesday can continue. The invalidation point is set at equilibrium of the Monday daily candle range which should remain respected into the following day.
Step Two: Confirmation
Confirmation is what bridges the gap between idea and execution. This is where many traders fail. They form a bias and then enter without waiting for the market to validate it. The focus is on execution over prediction every single time.
Once daily framework provides directional expectation, confirmation must occur inside the current day. I use daily profiles to validate whether the market is developing in alignment with the higher timeframe bias or showing an intent to trade elsewhere.
There are three types of daily profiles. One of the clearest examples is the London reversal profile. If price forms a low during London, confirms the intraday reversal, and begins expanding into New York, that development supports the bullish continuation. The same logic applies in reverse for bearish setups.
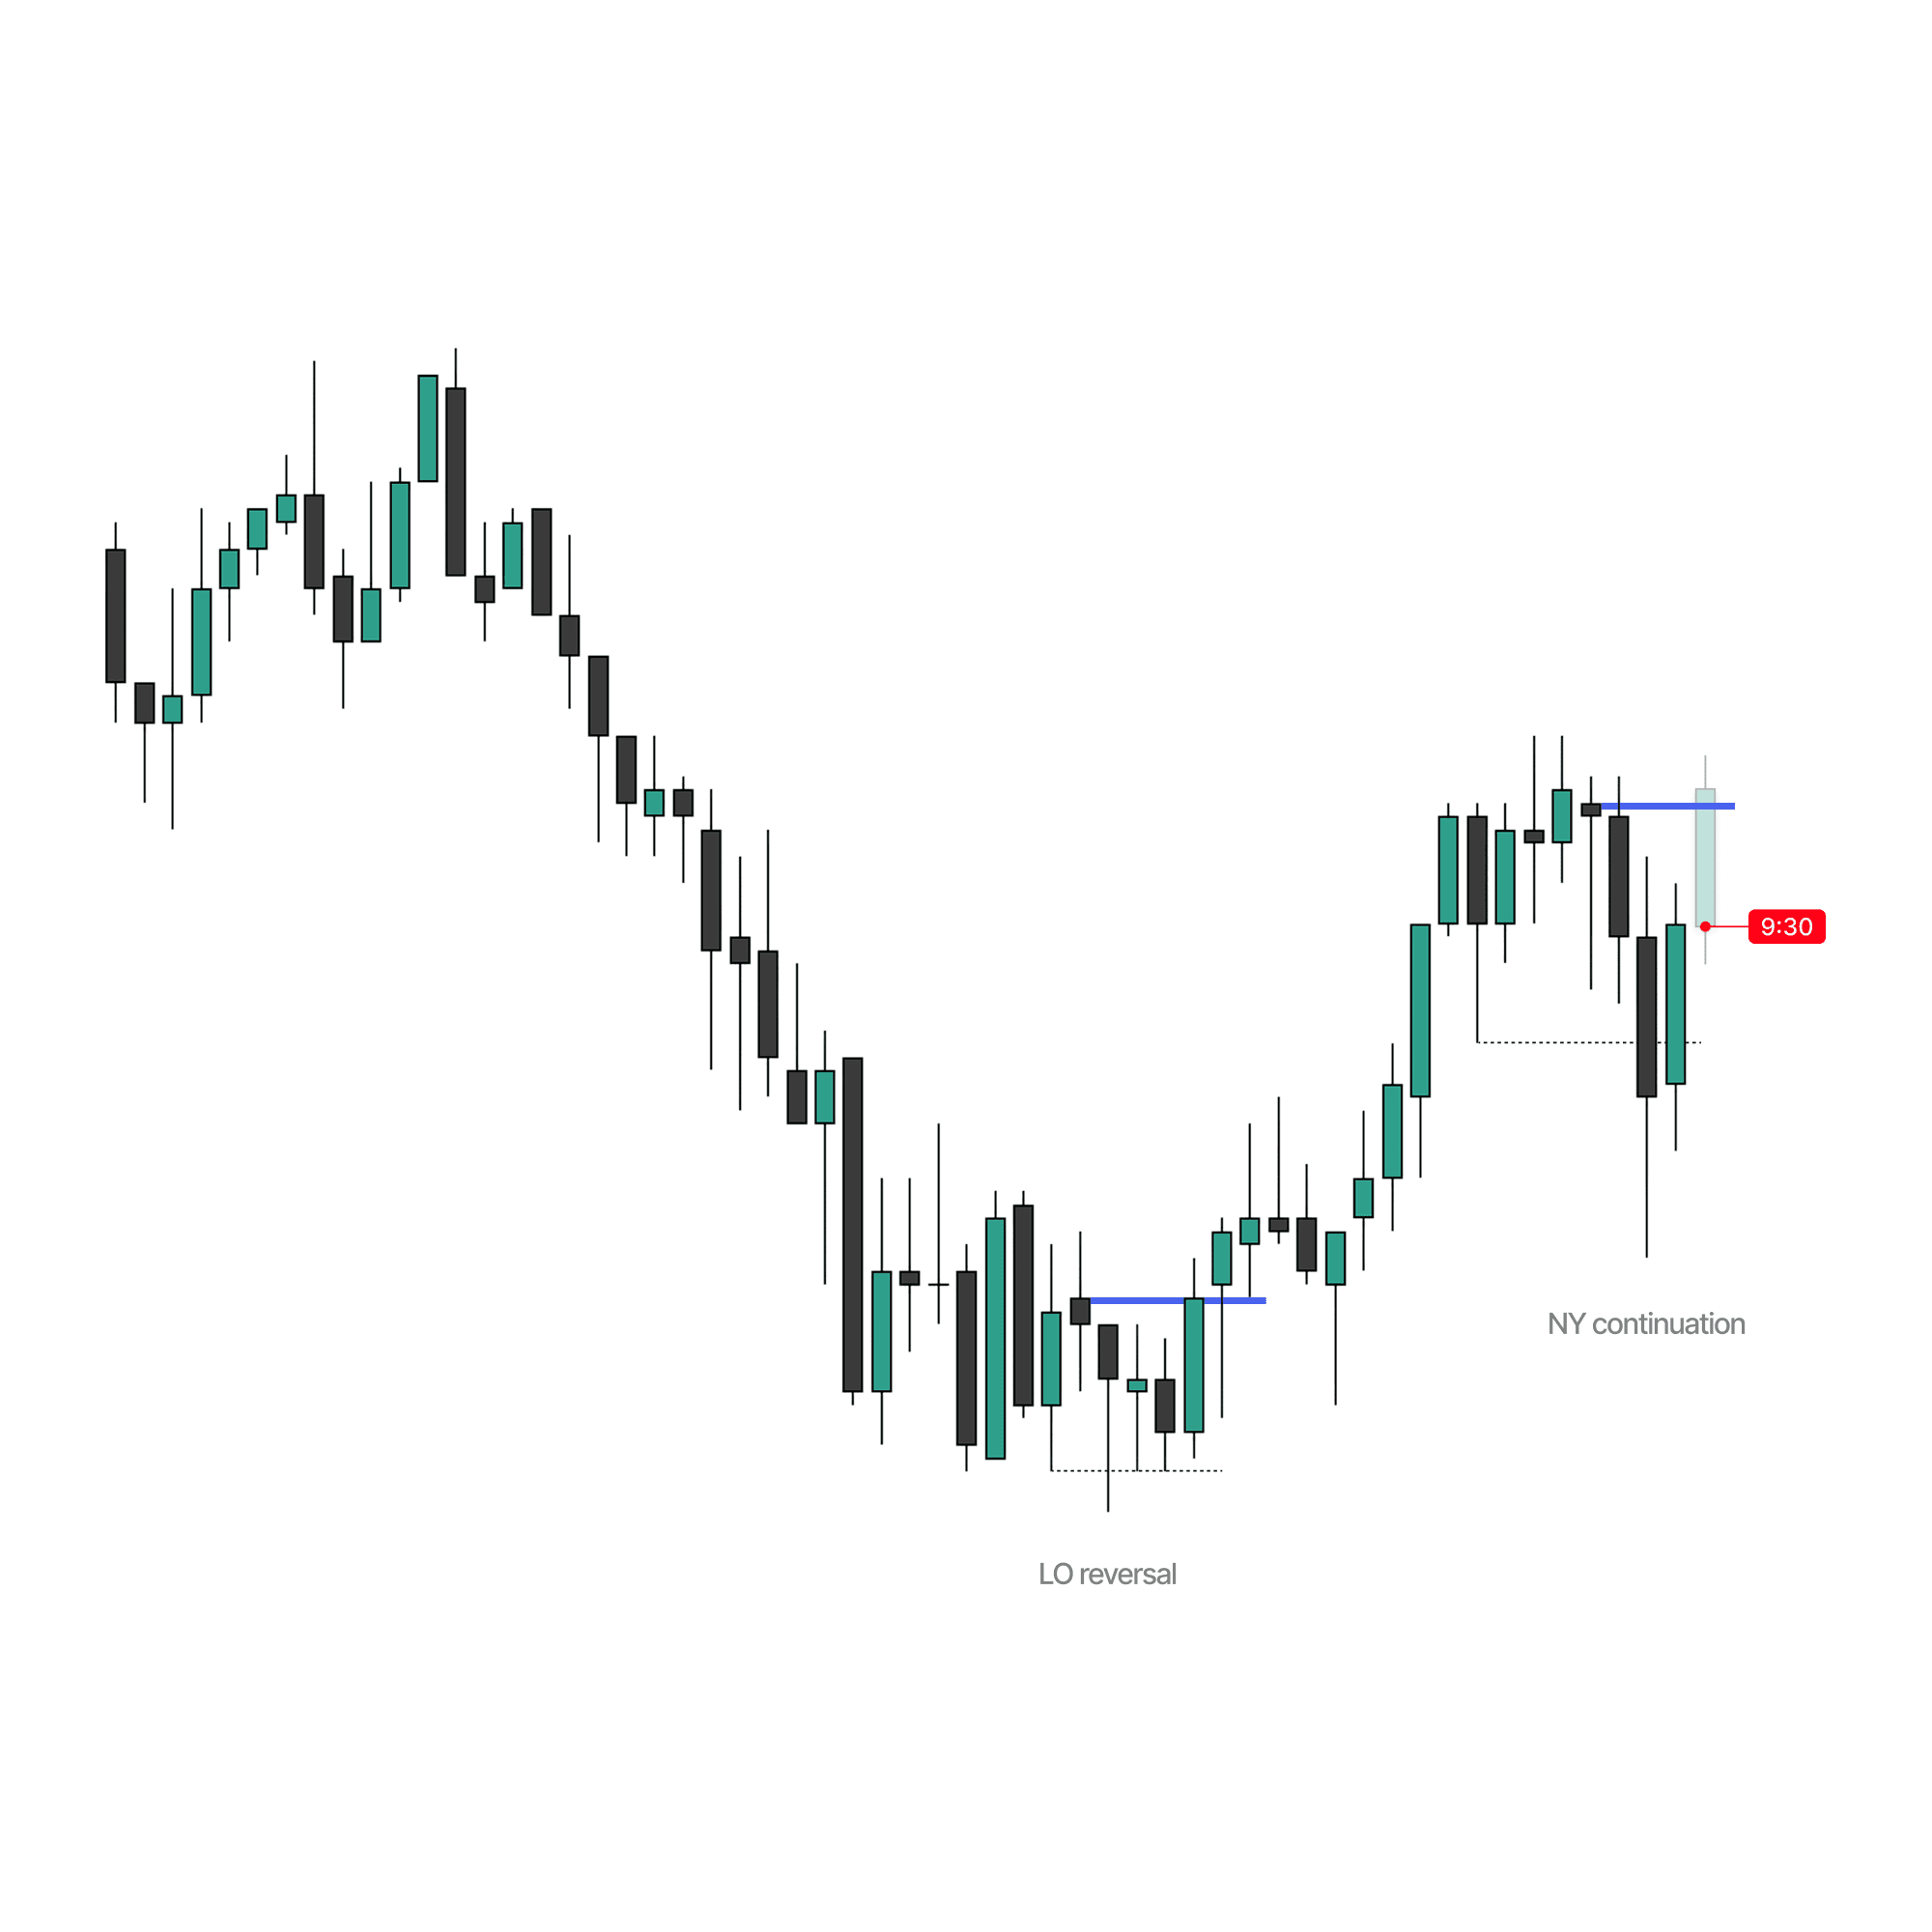
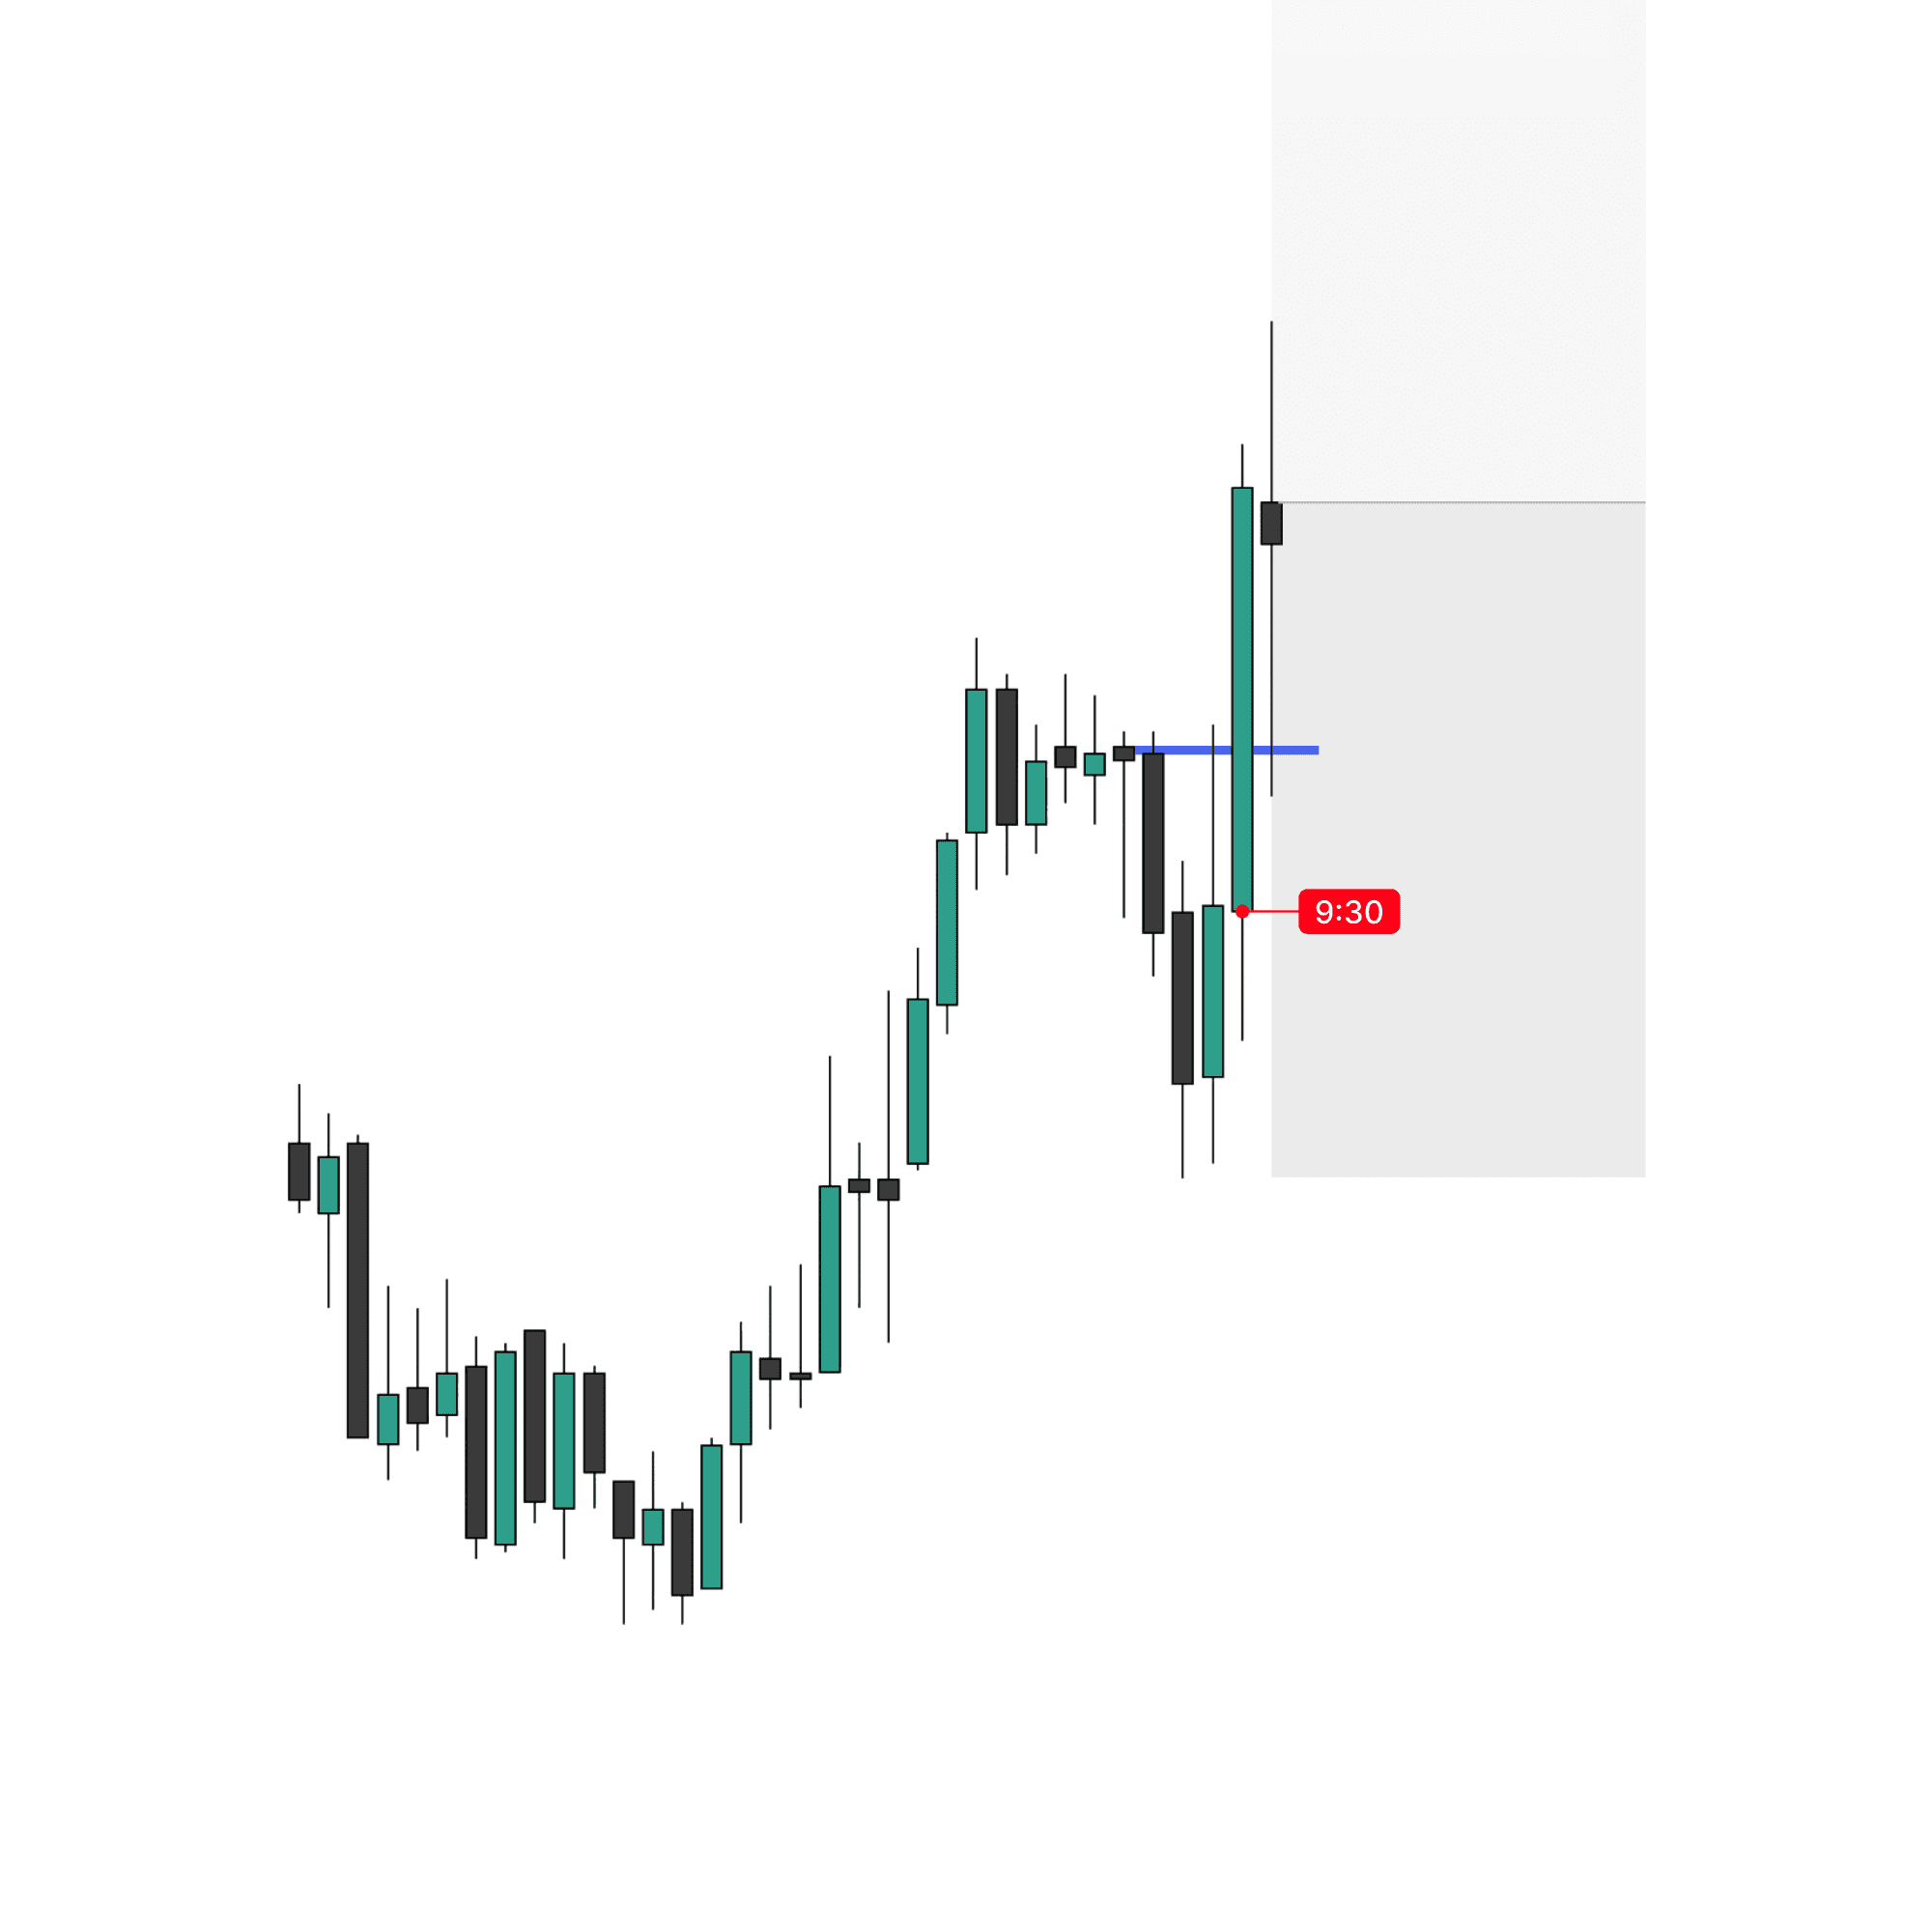
Another important component is how price moves relative to the daily open. Expansion days most often begin with shallow opposing runs from the daily open. That allows price to expand and form the body of the daily candle which we look to capture. Large wicks on the daily candle most often lead to indecisive intraday price action which remains inside the range.
This trade example presents both a shallow opposing run from the daily open and alignment of a bullish daily profile going into the New York session. Under ideal conditions, we shift our focus to entry.
Step Three: Entry
Once framework and confirmation align, the setup becomes actionable. Entry is not about capturing the exact high or low of the day. It is about positioning within expansion once continuation is underway.
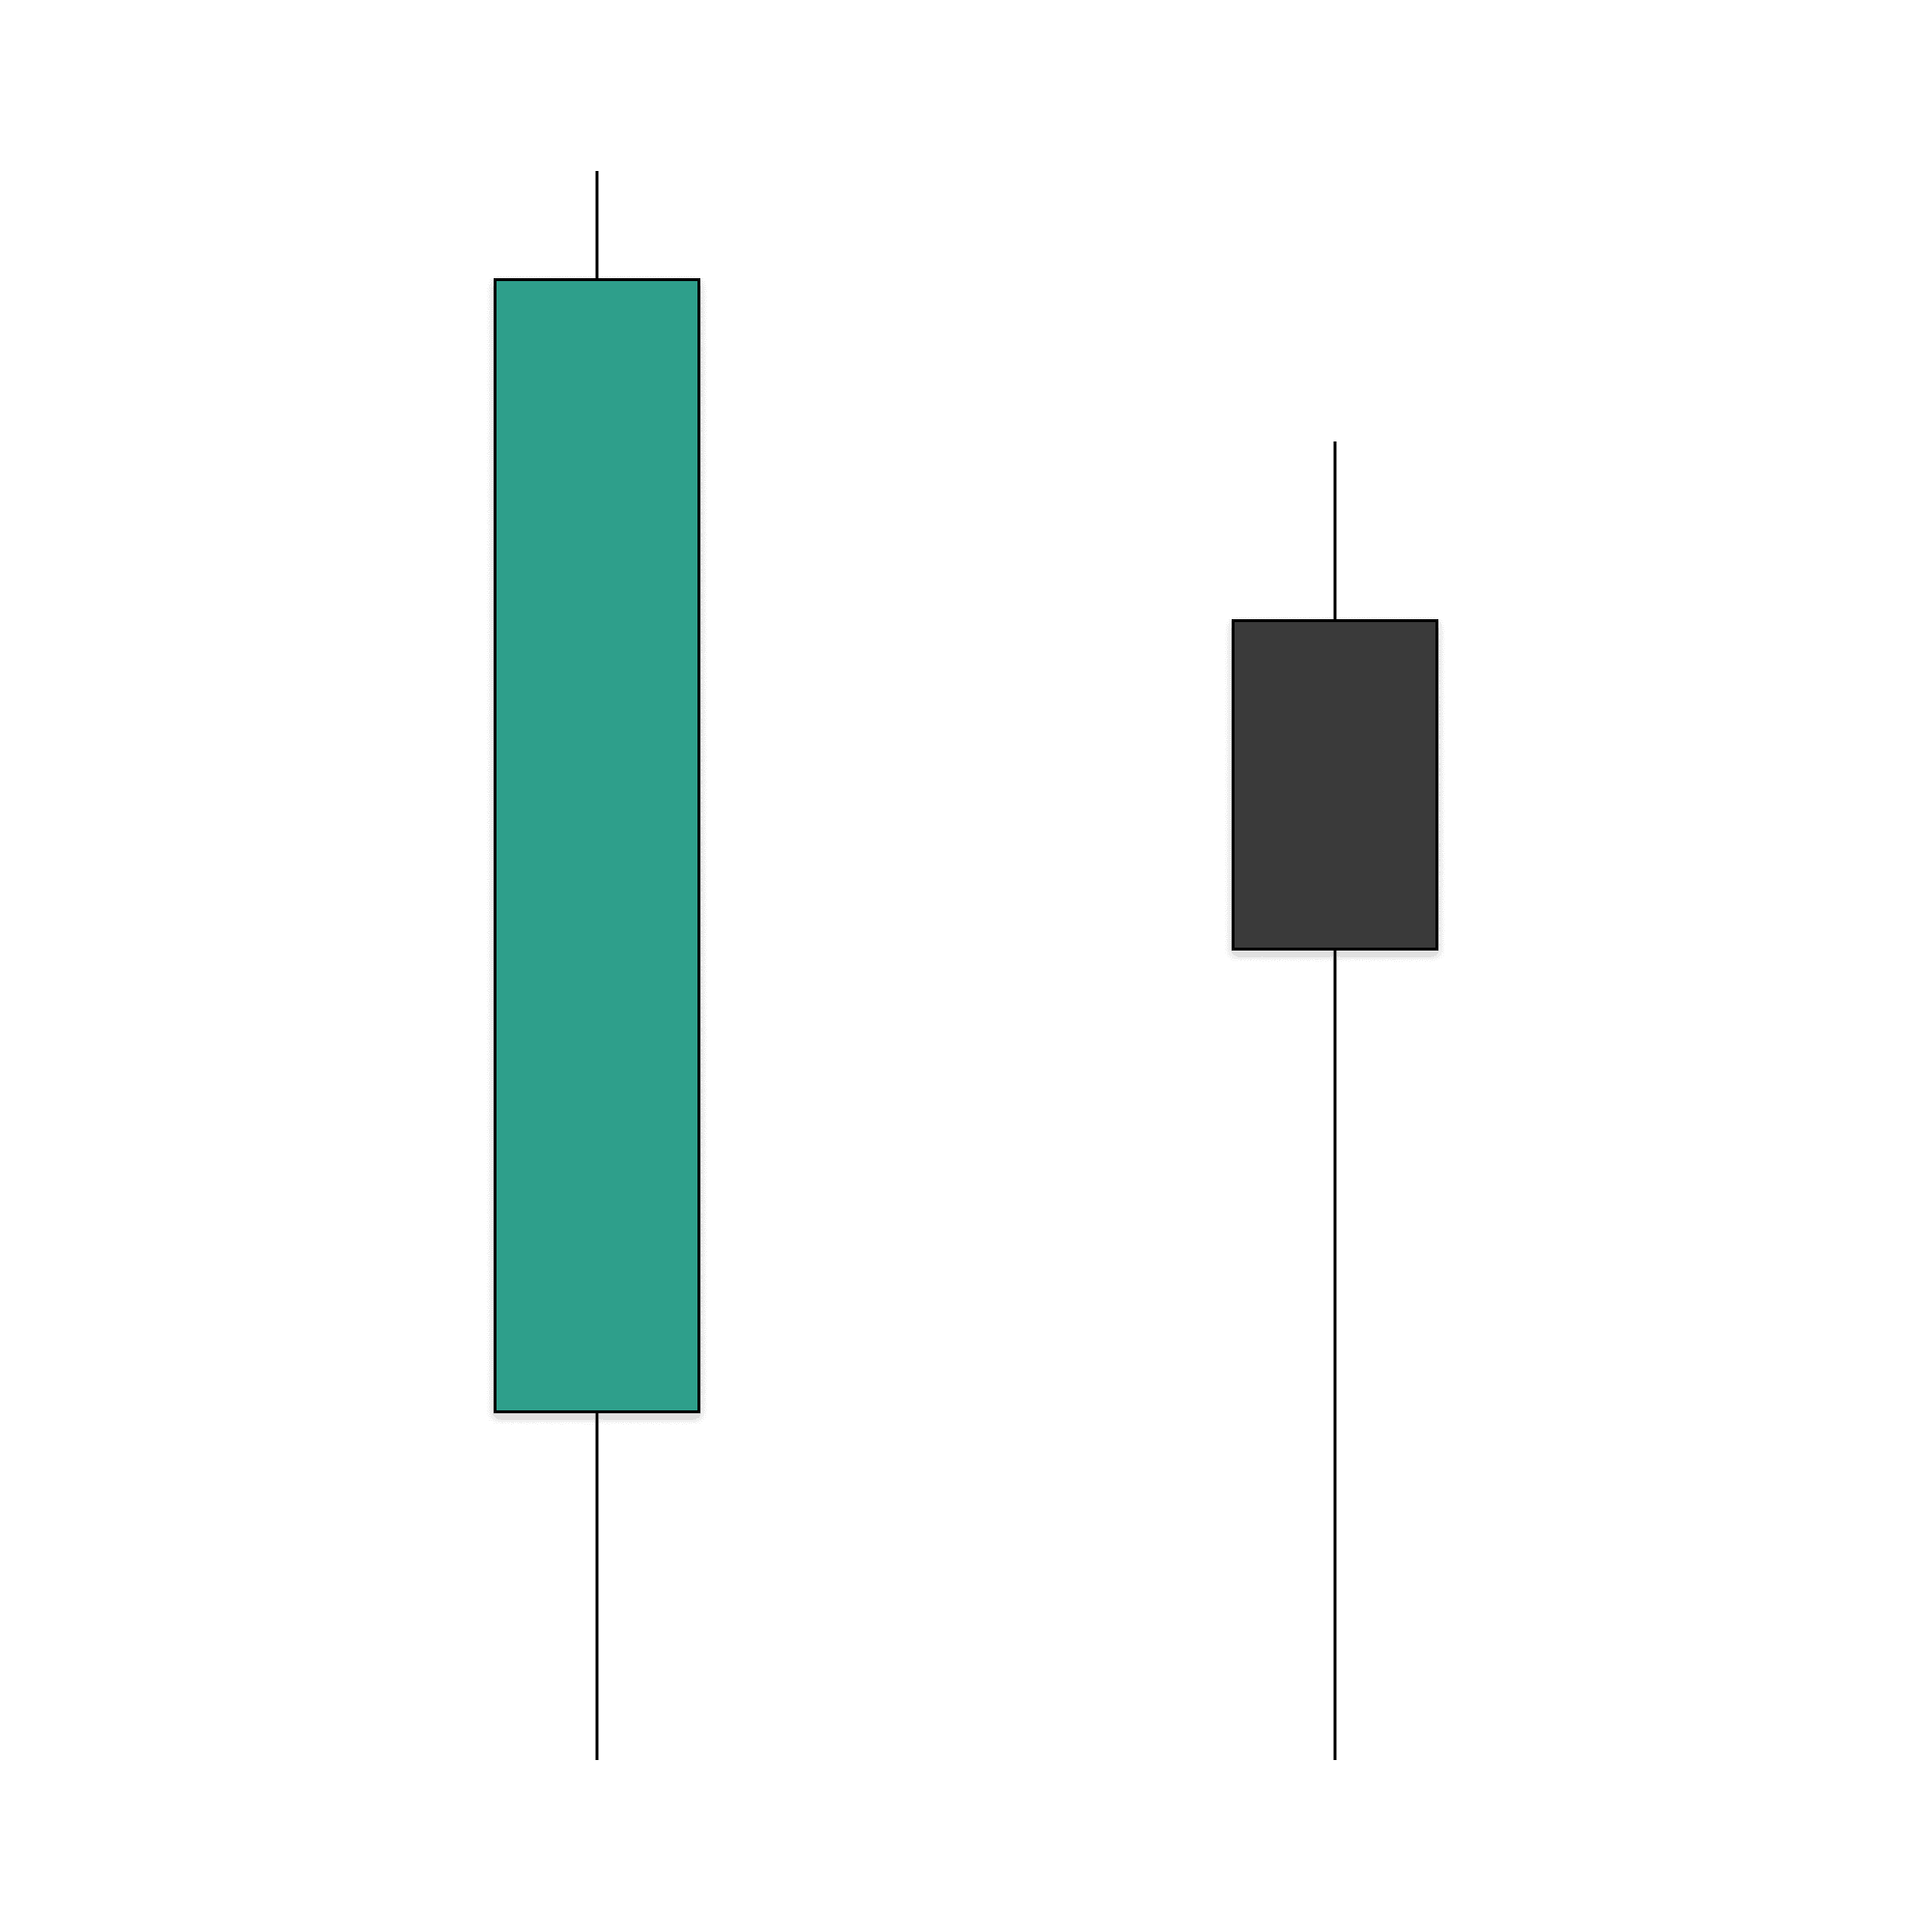
In my execution, entries are taken on closures through valid opposing candles in the continuation. I do not require a perfect retest. Waiting for idealized pullbacks often results in missed trades, and the few points gained rarely justify any lost opportunity. If risk to reward remains favorable at the open of the confirming signature, I enter on market orders to open the position.
I also evaluate relative strength and weakness across the correlated pairs. Choosing the correct pair is a crucial factor in execution as it can be the difference between being stopped out or not and the extent that the trade follows through.
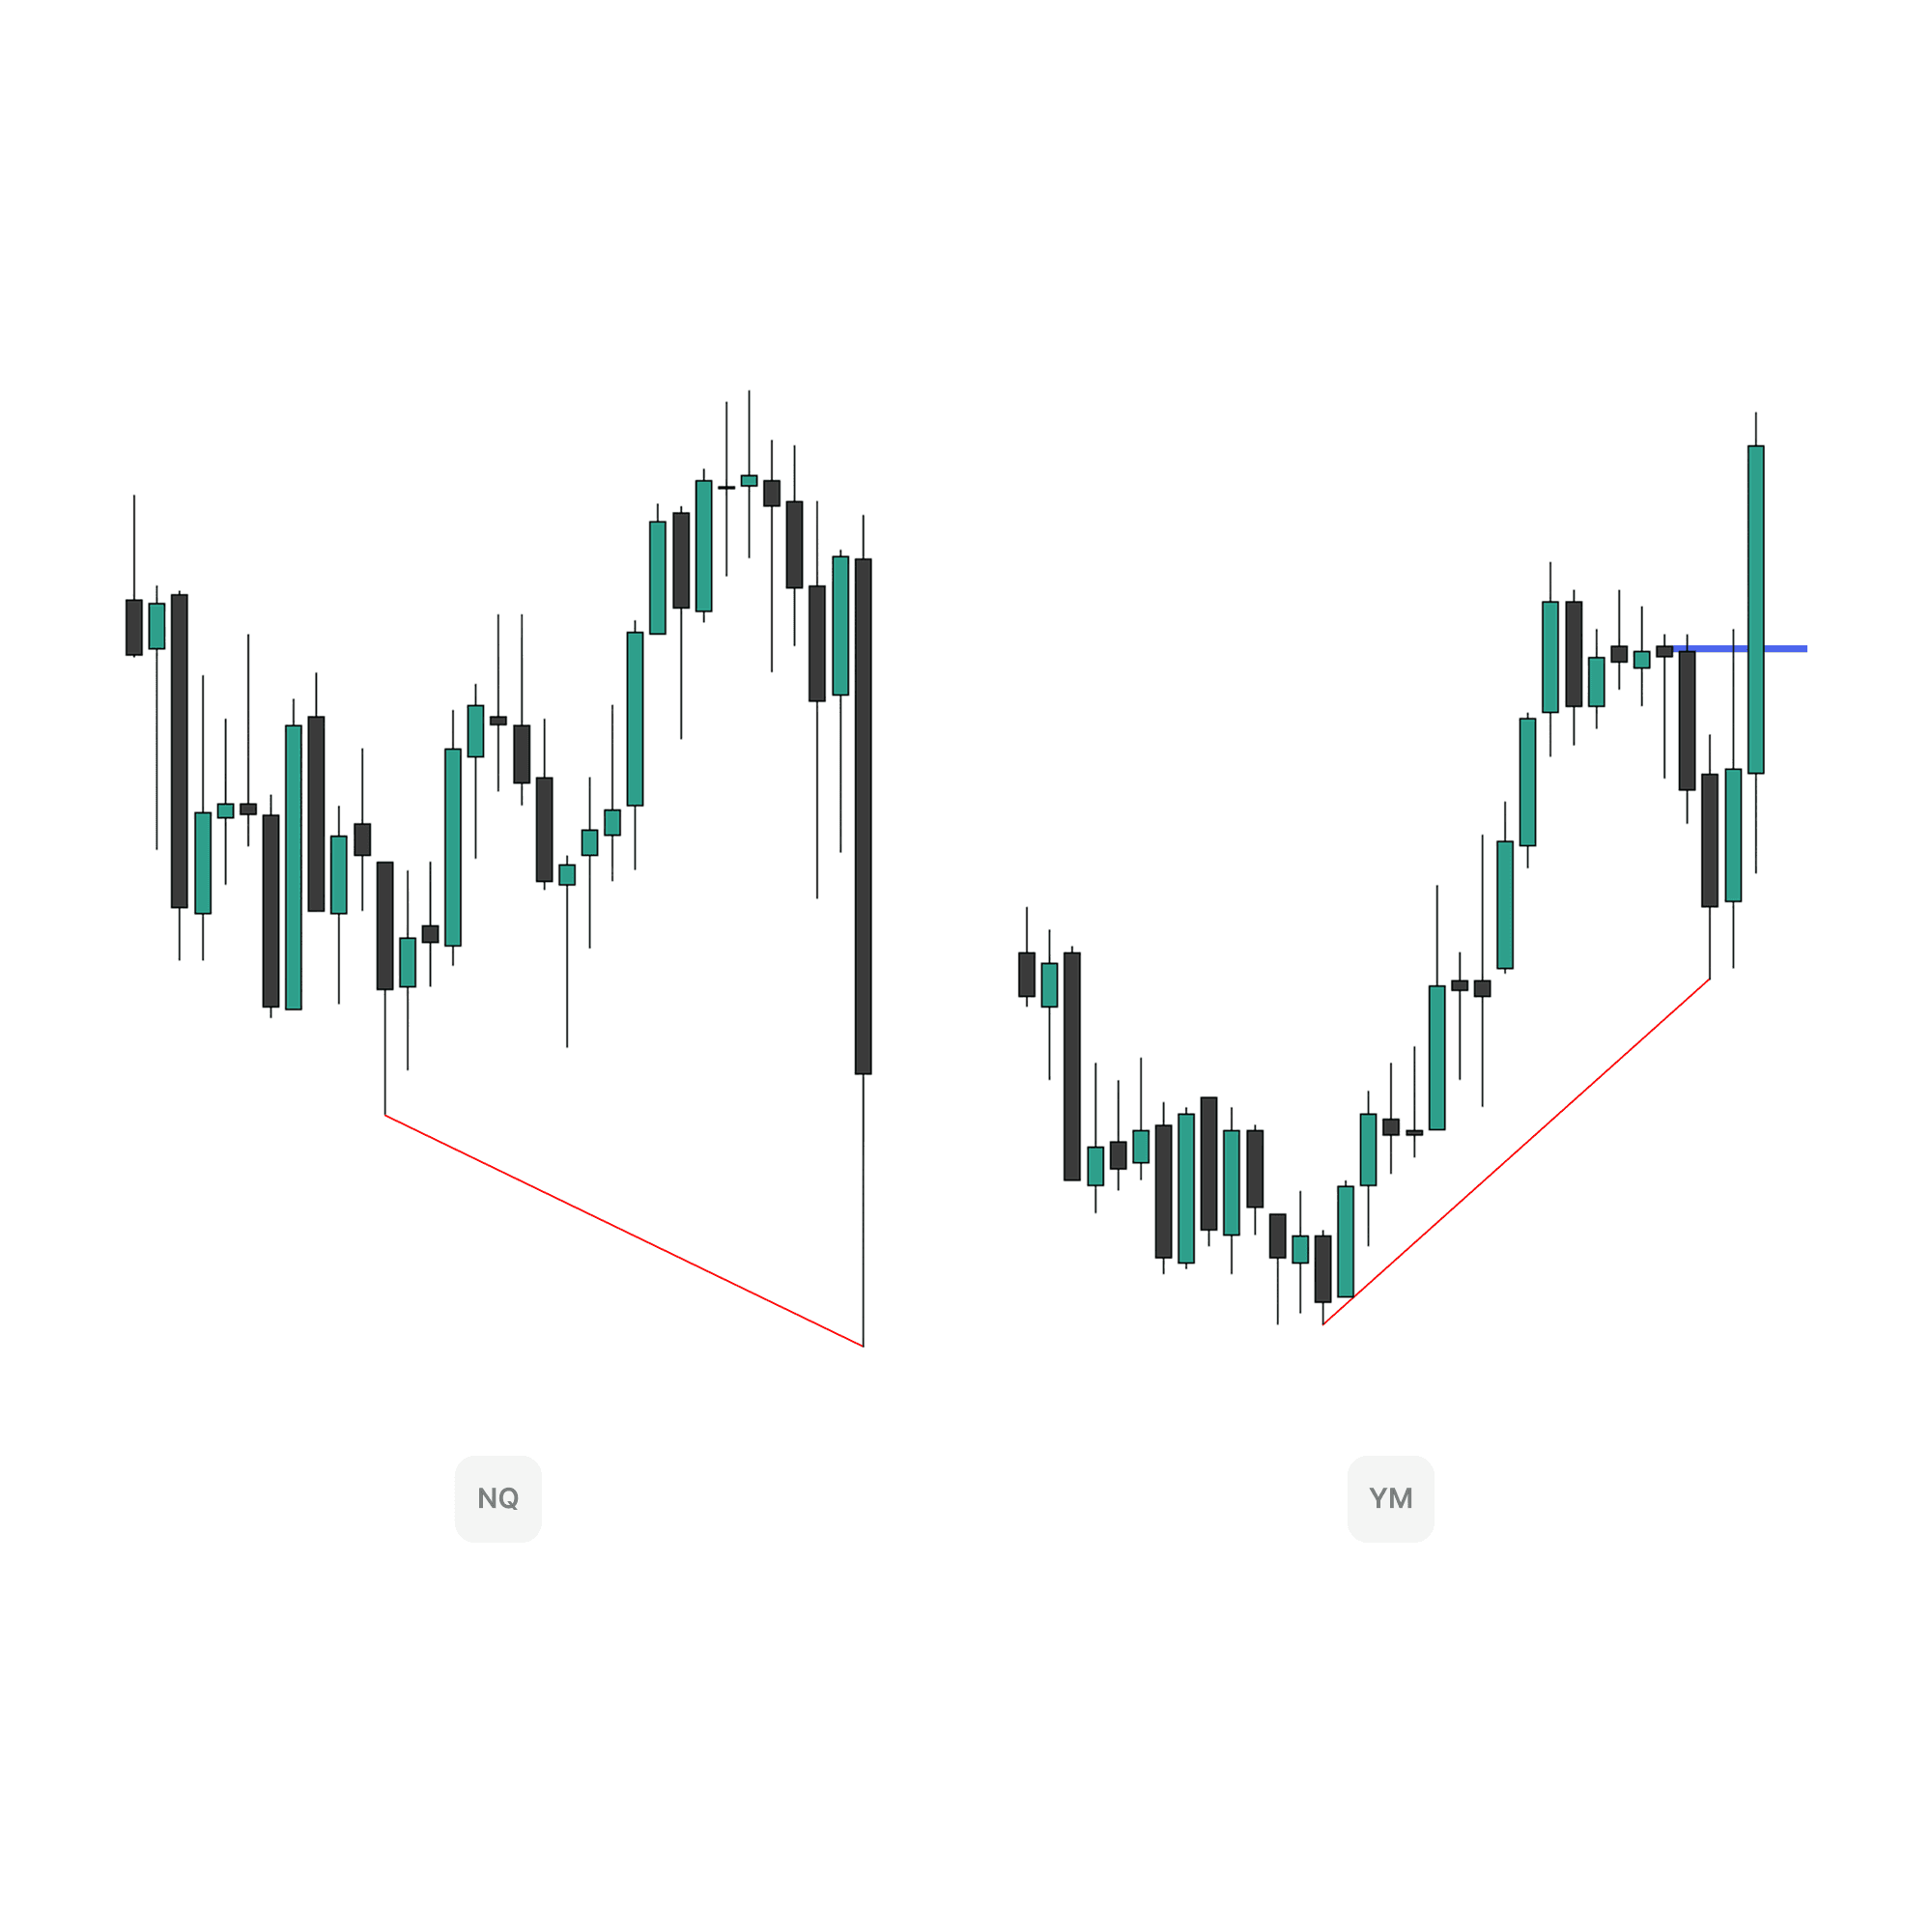
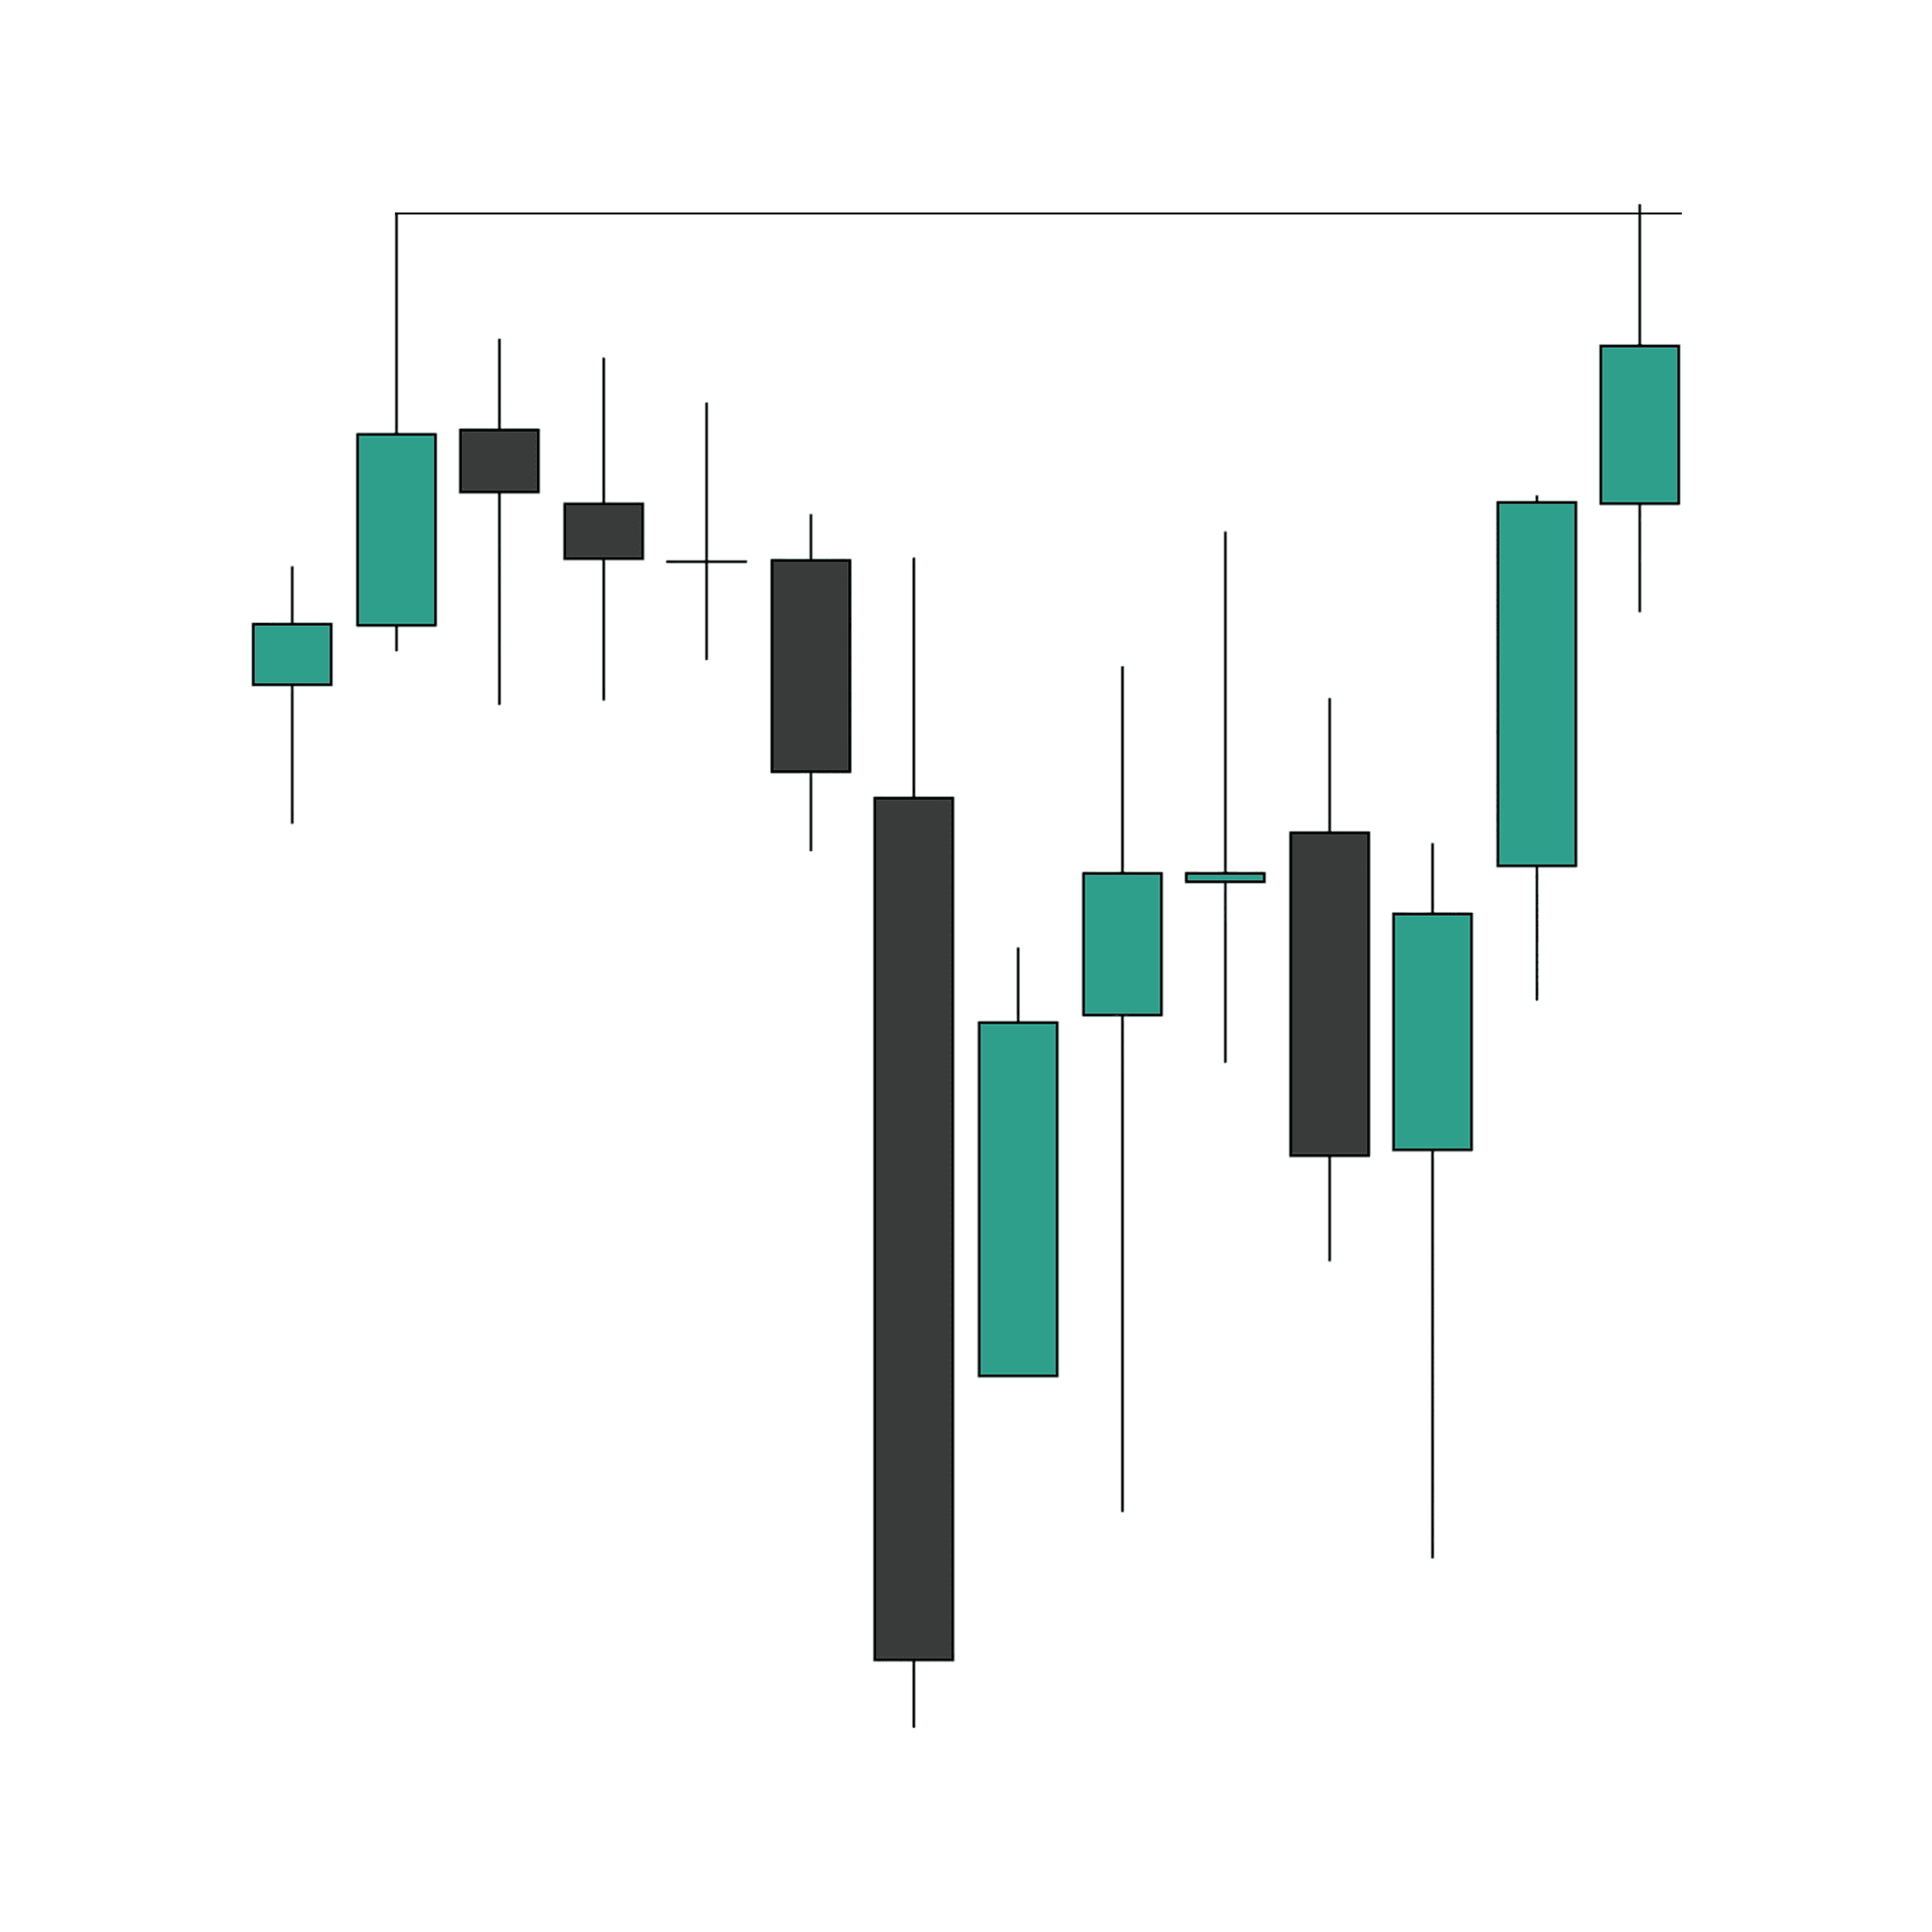
In this trade example, we understand the bias and confirmation are placing our entire focus to the upside. As volatility enters the market at the New York session open, NQ shows weakness by running out the intraday low and YM shows strength by holding up and getting the closure through downclose candles. This establishes a divergence off the lows which acts as confluence and gives reason to enter long on YM as the strongest pair to the upside.
The 5m timeframe shows an entry signature being validated by the candle close above. Upon the open of the next candle, the position is opened with a stop loss at the opposing low. It is at this point that we expect the higher timeframe idea for price to draw higher, allowing this trade to work out while having a position in the market to capitalize on it.
Step Four: Management
Trade management determines profitability more than entry precision. Poor management destroys high quality setups, while disciplined management extracts full value from valid days.
The first rule is to avoid micromanagement. Once entered, the trade is left untouched unless it reaches the predefined stop loss or a defined risk to reward objective. Exiting prematurely because price briefly consolidates near entry is one of the most common execution errors.
My baseline objective is 2R. As a lower frequency trader, typically taking two to four trades per week, I require that level of reward to justify the patience. At 2R, I scale a majority portion of the position. However, management remains dynamic. If higher timeframe targets remain open and the market continues to expand, I allow a portion of the position to run to maximize profit value.
Final profit targets are often aligned with opposing relevant highs or lows identified during daily framework. When price reaches an extreme objective with no further levels of significance in close proximity, I close fully. The goal is not to predict when the move will end, but to work within expectations to achieve as much value as possible.
Management completes the process. Without it, even correct bias and entry cannot produce consistent results.
Starting to Implement the Steps
Each step serves a distinct function. Framework defines directional expectation from higher timeframe structure. Confirmation validates that expectation. Entry positions within expansion once aligned. Management protects downside while maximizing the opportunity.
Removing any layer weakens the system. Trading without framework creates randomness. Trading without confirmation creates emotional entries. Trading without defined management creates volatility in results. When all four are applied in sequence, decision making becomes structured and repeatable.
To apply this process, begin on the daily chart. Identify relevant swings and determine whether price is showing signs of manipulation or continuation. Form a directional expectation for the following day when provided.
During the trading day, observe the development of the daily profile. Wait for confirmation before positioning. Enter on continuation signatures rather than attempting to anticipate reversals at the high or low of day. Manage the position with predefined rules while seeking 2R as the baseline.
Through repetition, you will begin to see how higher timeframes consistently influence expansion. The process is not complicated, but it demands discipline.
A trading system must control bias, timing, and risk. These four steps accomplish that. Every trade I take is filtered through this structure for that exact reason.
Prop
Learn
Explore mentorship with

AM and

TTrades
The standard of trading guidance
Prop
Learn
Get funded with the prop
firms I trade with
Use code AM for the best discount
Watch on YouTube
An Overview of the Steps
Traders often struggle because they lack a structured approach to the markets. Without a defined process, bias constantly shifts, entries become reactive, and management turns emotional. A real system must control direction, execution, and risk from start to finish.
Every trade I take follows four specific steps of framework, confirmation, entry, and management. This is a layered approach designed to align higher timeframes with intraday confirmation while protecting downside risk. Each step has a defined purpose. When applied together, they create consistency and remove unnecessary decision making.
This article breaks down exactly how the process works and how each step builds on the one before it.
Step One: Framework
Framework establishes directional bias for the trading day where we focus on one side and filter out the rest. It is built using the daily timeframe, not the weekly or hourly charts.
The weekly and monthly charts are too broad for short-term trading. An assumption formed on those timeframes can remain unresolved for extended periods, which conflicts with an intraday approach. Lower timeframes provide too much detail and often distract from the larger objective. The daily chart provides balance. It offers enough clarity while allowing for adjustment to the development day by day.
Inside my system, daily framework begins by identifying relevant highs and lows at the extremes of price. These extremes are determined using the understanding of failure swings, price separation, and a defined lookback period. When price engages a true extreme, we know the reaction carries weight.
There are two reactions that matter at these levels. A manipulation, where price trades into a level and closes back within range which suggests a reversal. A deep close through a level signals continuation. From this, an expectation is formed for the following day.
Below we have a one-sided framework in the market using relevant swing logic on the daily. Off the lows is a valid manipulation which establishes the initial reversal. The following day expands away from the low and has a deep close through the relevant high to the left. These reactions create the assumption that the next daily candle will continue to the failure swings above which act as the draw on price.
Additional logic can be added to the framework. The weekly profile can be utilized to understand that when Monday reverses, Tuesday can continue. The invalidation point is set at equilibrium of the Monday daily candle range which should remain respected into the following day.
Step Two: Confirmation
Confirmation is what bridges the gap between idea and execution. This is where many traders fail. They form a bias and then enter without waiting for the market to validate it. The focus is on execution over prediction every single time.
Once daily framework provides directional expectation, confirmation must occur inside the current day. I use daily profiles to validate whether the market is developing in alignment with the higher timeframe bias or showing an intent to trade elsewhere.
There are three types of daily profiles. One of the clearest examples is the London reversal profile. If price forms a low during London, confirms the intraday reversal, and begins expanding into New York, that development supports the bullish continuation. The same logic applies in reverse for bearish setups.
Another important component is how price moves relative to the daily open. Expansion days most often begin with shallow opposing runs from the daily open. That allows price to expand and form the body of the daily candle which we look to capture. Large wicks on the daily candle most often lead to indecisive intraday price action which remains inside the range.
This trade example presents both a shallow opposing run from the daily open and alignment of a bullish daily profile going into the New York session. Under ideal conditions, we shift our focus to entry.
Step Three: Entry
Once framework and confirmation align, the setup becomes actionable. Entry is not about capturing the exact high or low of the day. It is about positioning within expansion once continuation is underway.
In my execution, entries are taken on closures through valid opposing candles in the continuation. I do not require a perfect retest. Waiting for idealized pullbacks often results in missed trades, and the few points gained rarely justify any lost opportunity. If risk to reward remains favorable at the open of the confirming signature, I enter on market orders to open the position.
I also evaluate relative strength and weakness across the correlated pairs. Choosing the correct pair is a crucial factor in execution as it can be the difference between being stopped out or not and the extent that the trade follows through.
In this trade example, we understand the bias and confirmation are placing our entire focus to the upside. As volatility enters the market at the New York session open, NQ shows weakness by running out the intraday low and YM shows strength by holding up and getting the closure through downclose candles. This establishes a divergence off the lows which acts as confluence and gives reason to enter long on YM as the strongest pair to the upside.
The 5m timeframe shows an entry signature being validated by the candle close above. Upon the open of the next candle, the position is opened with a stop loss at the opposing low. It is at this point that we expect the higher timeframe idea for price to draw higher, allowing this trade to work out while having a position in the market to capitalize on it.
Step Four: Management
Trade management determines profitability more than entry precision. Poor management destroys high quality setups, while disciplined management extracts full value from valid days.
The first rule is to avoid micromanagement. Once entered, the trade is left untouched unless it reaches the predefined stop loss or a defined risk to reward objective. Exiting prematurely because price briefly consolidates near entry is one of the most common execution errors.
My baseline objective is 2R. As a lower frequency trader, typically taking two to four trades per week, I require that level of reward to justify the patience. At 2R, I scale a majority portion of the position. However, management remains dynamic. If higher timeframe targets remain open and the market continues to expand, I allow a portion of the position to run to maximize profit value.
Final profit targets are often aligned with opposing relevant highs or lows identified during daily framework. When price reaches an extreme objective with no further levels of significance in close proximity, I close fully. The goal is not to predict when the move will end, but to work within expectations to achieve as much value as possible.
Management completes the process. Without it, even correct bias and entry cannot produce consistent results.
Starting to Implement the Steps
Each step serves a distinct function. Framework defines directional expectation from higher timeframe structure. Confirmation validates that expectation. Entry positions within expansion once aligned. Management protects downside while maximizing the opportunity.
Removing any layer weakens the system. Trading without framework creates randomness. Trading without confirmation creates emotional entries. Trading without defined management creates volatility in results. When all four are applied in sequence, decision making becomes structured and repeatable.
To apply this process, begin on the daily chart. Identify relevant swings and determine whether price is showing signs of manipulation or continuation. Form a directional expectation for the following day when provided.
During the trading day, observe the development of the daily profile. Wait for confirmation before positioning. Enter on continuation signatures rather than attempting to anticipate reversals at the high or low of day. Manage the position with predefined rules while seeking 2R as the baseline.
Through repetition, you will begin to see how higher timeframes consistently influence expansion. The process is not complicated, but it demands discipline.
A trading system must control bias, timing, and risk. These four steps accomplish that. Every trade I take is filtered through this structure for that exact reason.
Prop
Learn
Get funded with the prop firms I trade with
Use code AM for the best discount


Prop
Learn
Explore mentorship with
AM and
TTrades

Prop
Learn
Get funded with the prop firms I trade with
Use code AM for the best discount
Prop
Learn
Explore mentorship with
AM and
TTrades
Prop
Learn
Explore mentorship with
AM and
TTrades
The standard of trading guidance
Prop
Learn
Get funded with the prop
firms I trade with
Use code AM for the best discount
Prop
Learn
Explore mentorship with
AM and
TTrades
The standard of trading guidance
Prop
Learn
Get funded with the prop
firms I trade with
Use code AM for the best discount

The 4 Steps Behind My Trading System
Continue Learning.


© 2026 AM Trades. All Rights Reserved.
© 2026 AM Trades. All Rights Reserved.


© 2026 AM Trades. All Rights Reserved.