
Trades
Using Range Protocol to Capture Expansion
Consolidations are a common condition in the market that often lead to unnecessary losses from traders who do not understand how to navigate ranges. It is a simple process that focuses on the external range where the relevant swings exist and is key to sustaining profits in trading. This lesson breaks down each step through a real trade example in the market.
Understanding the Range Protocol
To understand ranges, you must first understand failure swings and relevant swings on the daily timeframe. Failure swings are unestablished reversals in the market that we do not trade away from. Once failure swings form on both sides of the market on the daily chart, that is the moment price is considered in a range. This is a neutral condition in the market as long as price remains internal to the relevant high and low that it sits between.
The one fact of ranged markets is that they are only as difficult to trade as you make them for yourself. Avoiding speculation or execution while price remains internal with failure swings on both sides of the market is the one rule to follow. This will keep you from trading within the consolidation and getting caught in low quality conditions where losses build up. Waiting for price to engage the external range where the relevant swings exist is where our focus goes.
Identifying Framework at the External Range
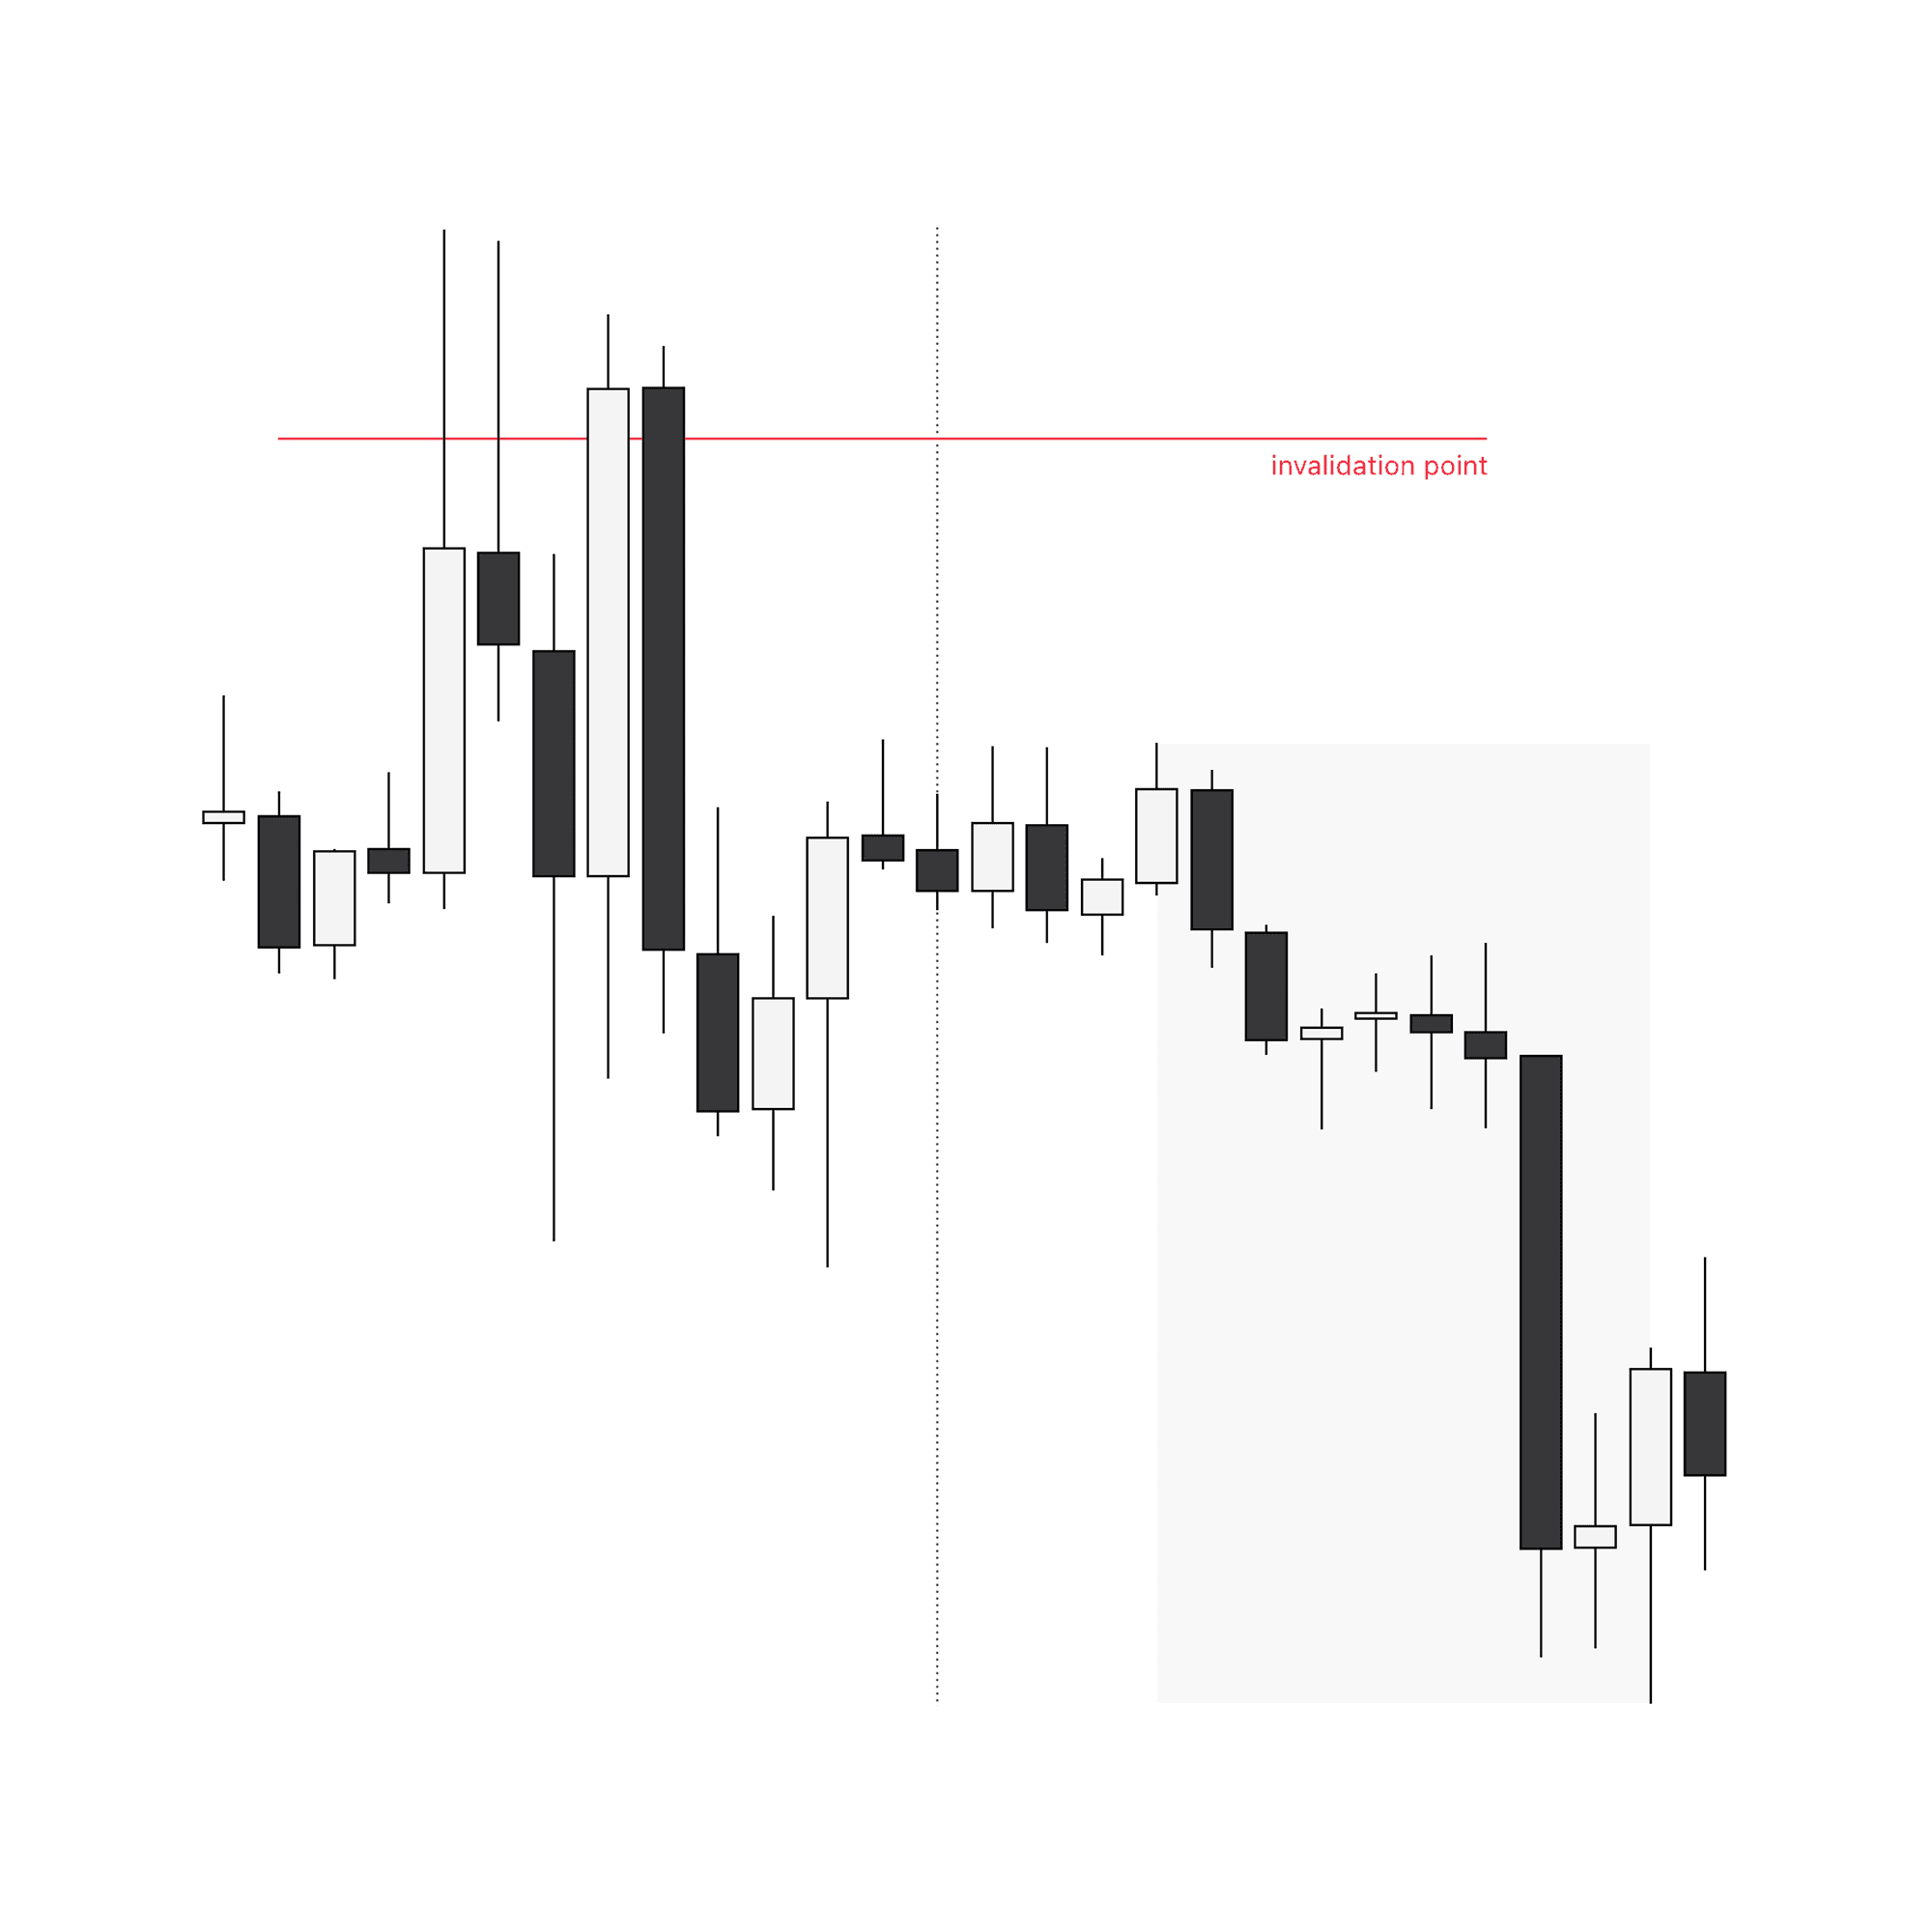
Once price engages the external range, the development and reaction at that point tell us where the market should go next. The development in this case shows an initial failed manipulation and then a valid manipulation on the following day. If the market manipulates a relevant swing on the previous day, then the current day should be an expansion away from the reversal if the daily profile aligns.
The invalidation point is set at the equilibrium of the opposing wick. This is an area in the market that price should remain in respect to, as it demands that the next day forms a small upper wick which supports expansion to the downside.
Confirmation Within the Daily Profile
The confirmation step is where ideas can become actionable. It allows us to take in all the information the market is proving to us to determine if the daily candle is developing in a way which will deliver the framework from the daily.
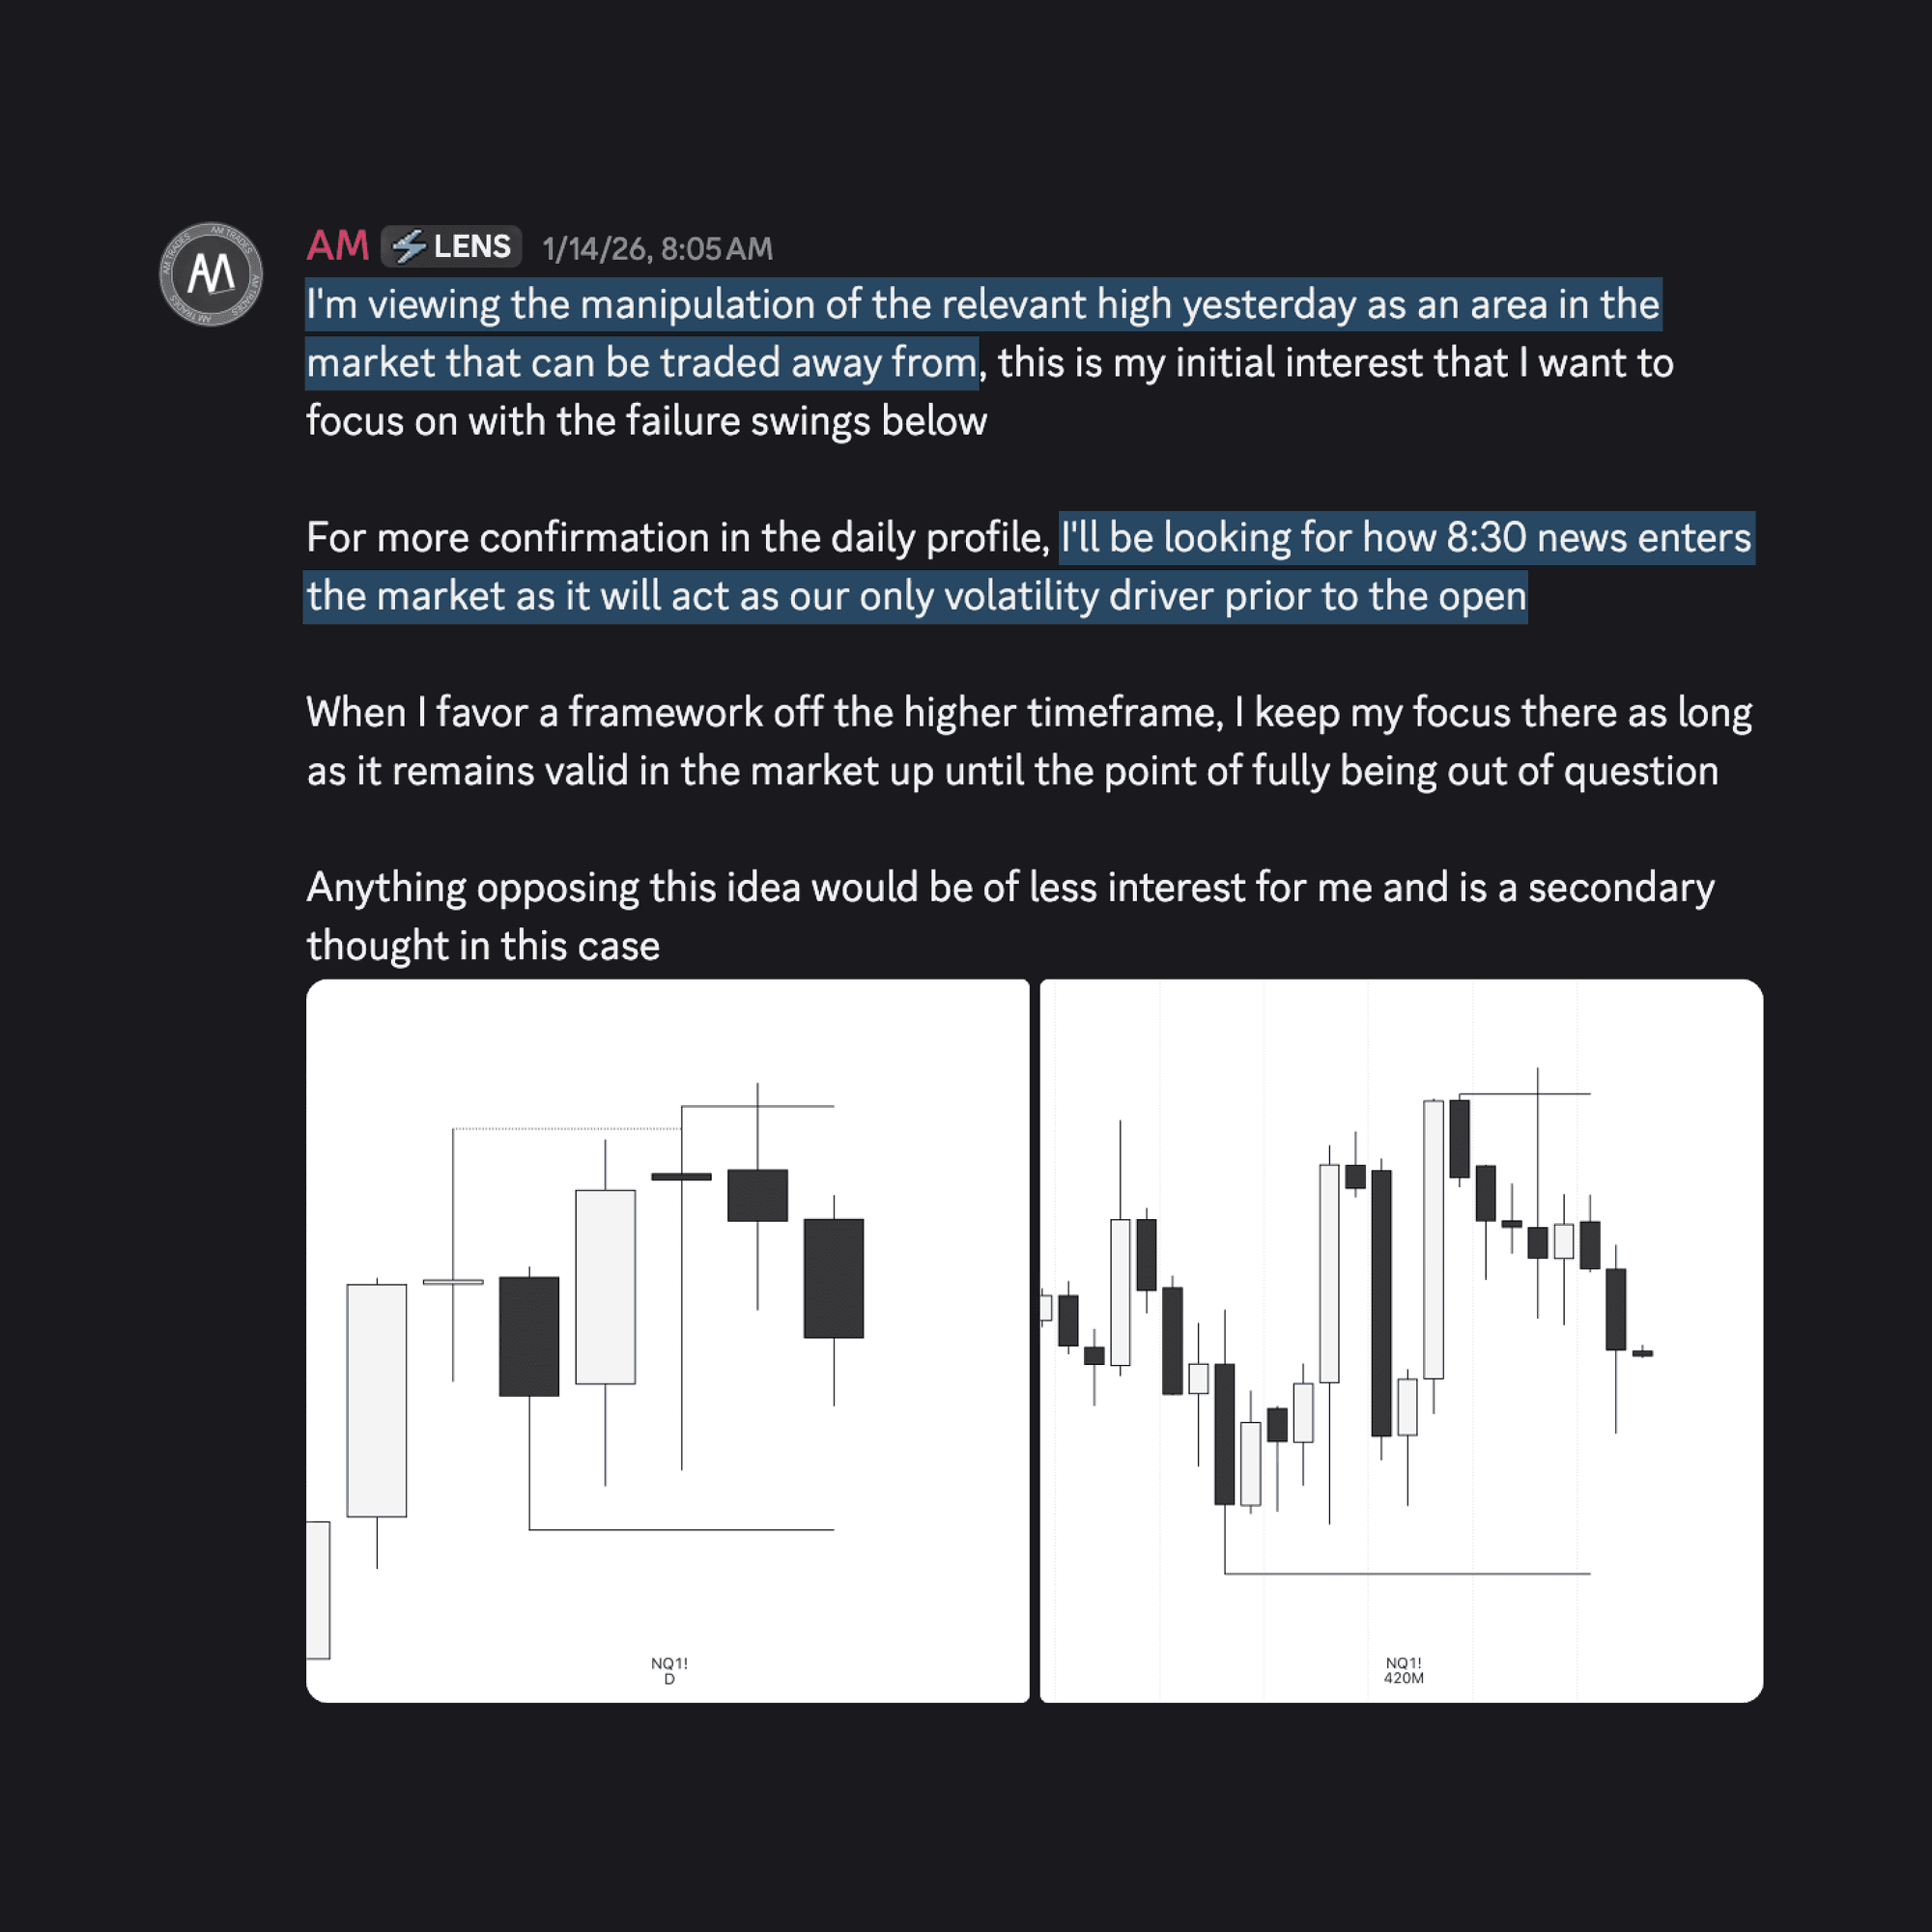
Viewing the structure of Asia and London on the morning of this trade, it shows that price has already established a high of day in respect to the invalidation point. The failure swings below on the other side of the range also remain open as a target in price. You can see the idea from the analysis post inside The Market Lens leading into the execution.
It is clear at this time that everything is presented to seek a quality trade.
Framework from the daily with a previous day manipulation
High of day established in respect to the invalidation point
Failure swings remain open below providing an objective
When these factors are presented under the system, it is assumed the daily candle is in continuation with room to expand through the New York session. This is the ideal condition to position within once all steps are aligned. The only focus at this point is a valid entry signature to get onside and capitalize.
Entry Signature in the Continuation
With the focus on the continuation, timing the entry on a valid signature is the final piece. We hold high conviction that the daily candle will expand lower. All that needs to be done is positioning in the market without being stopped out.
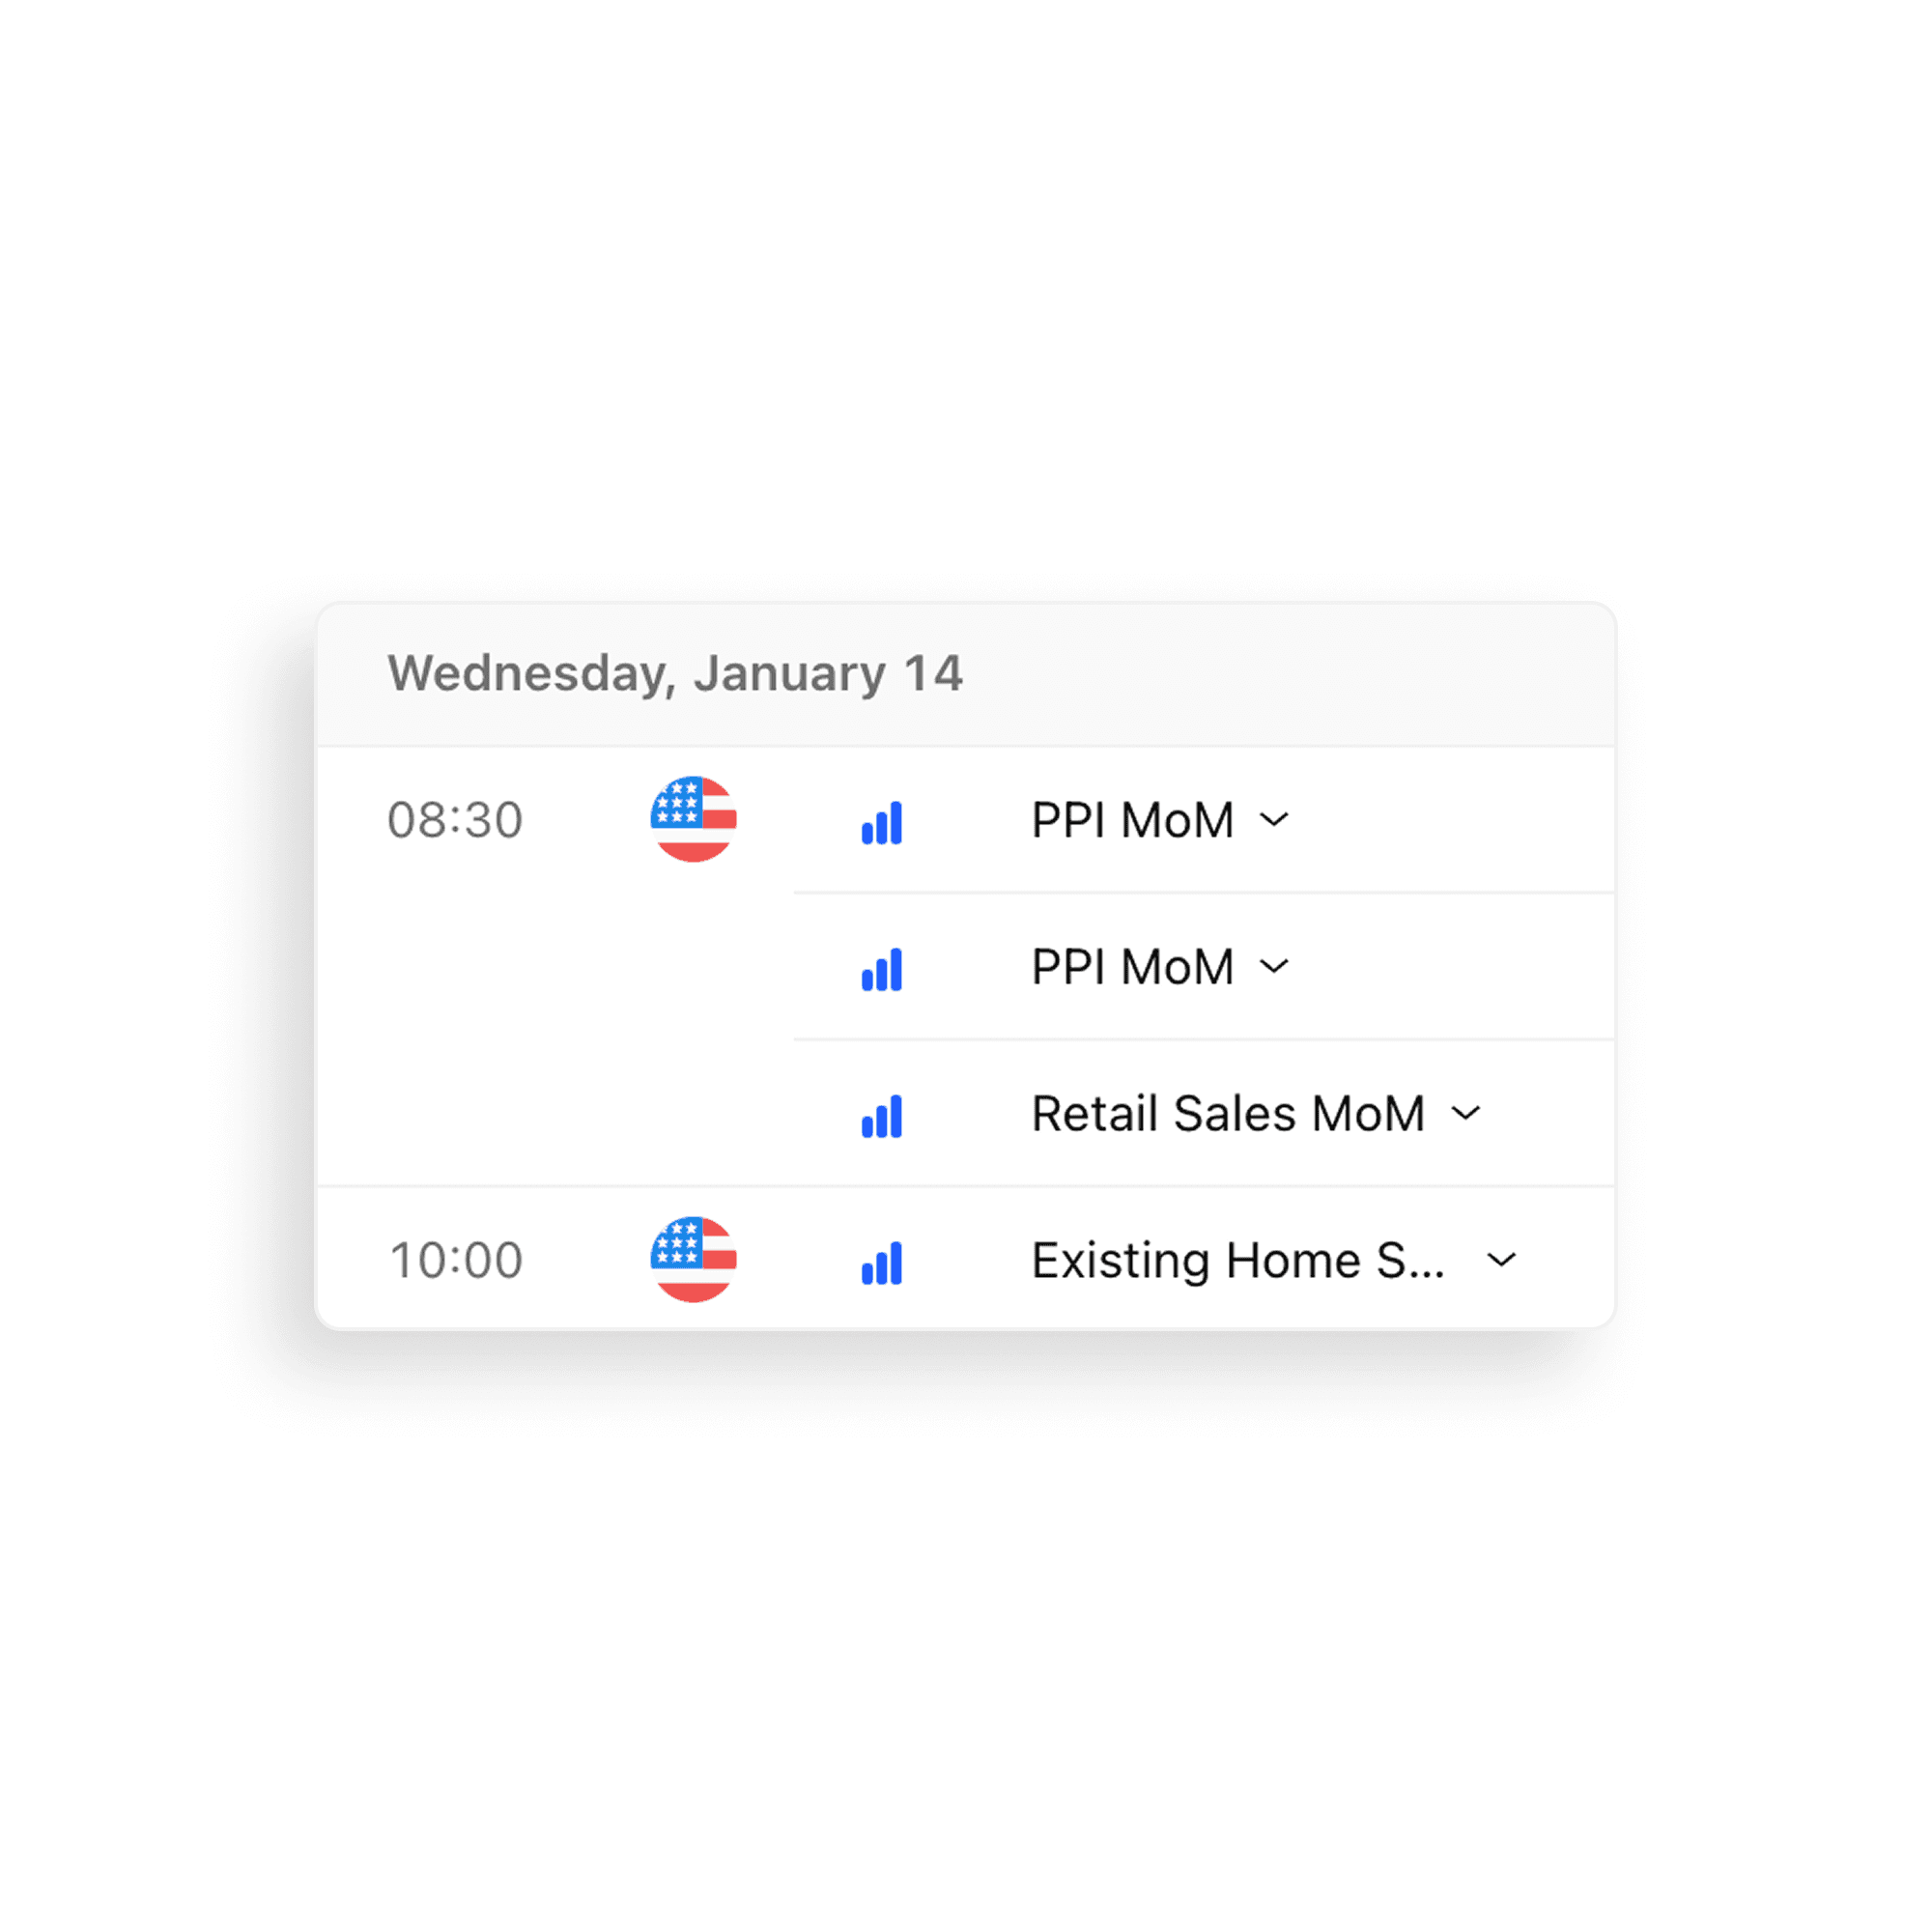
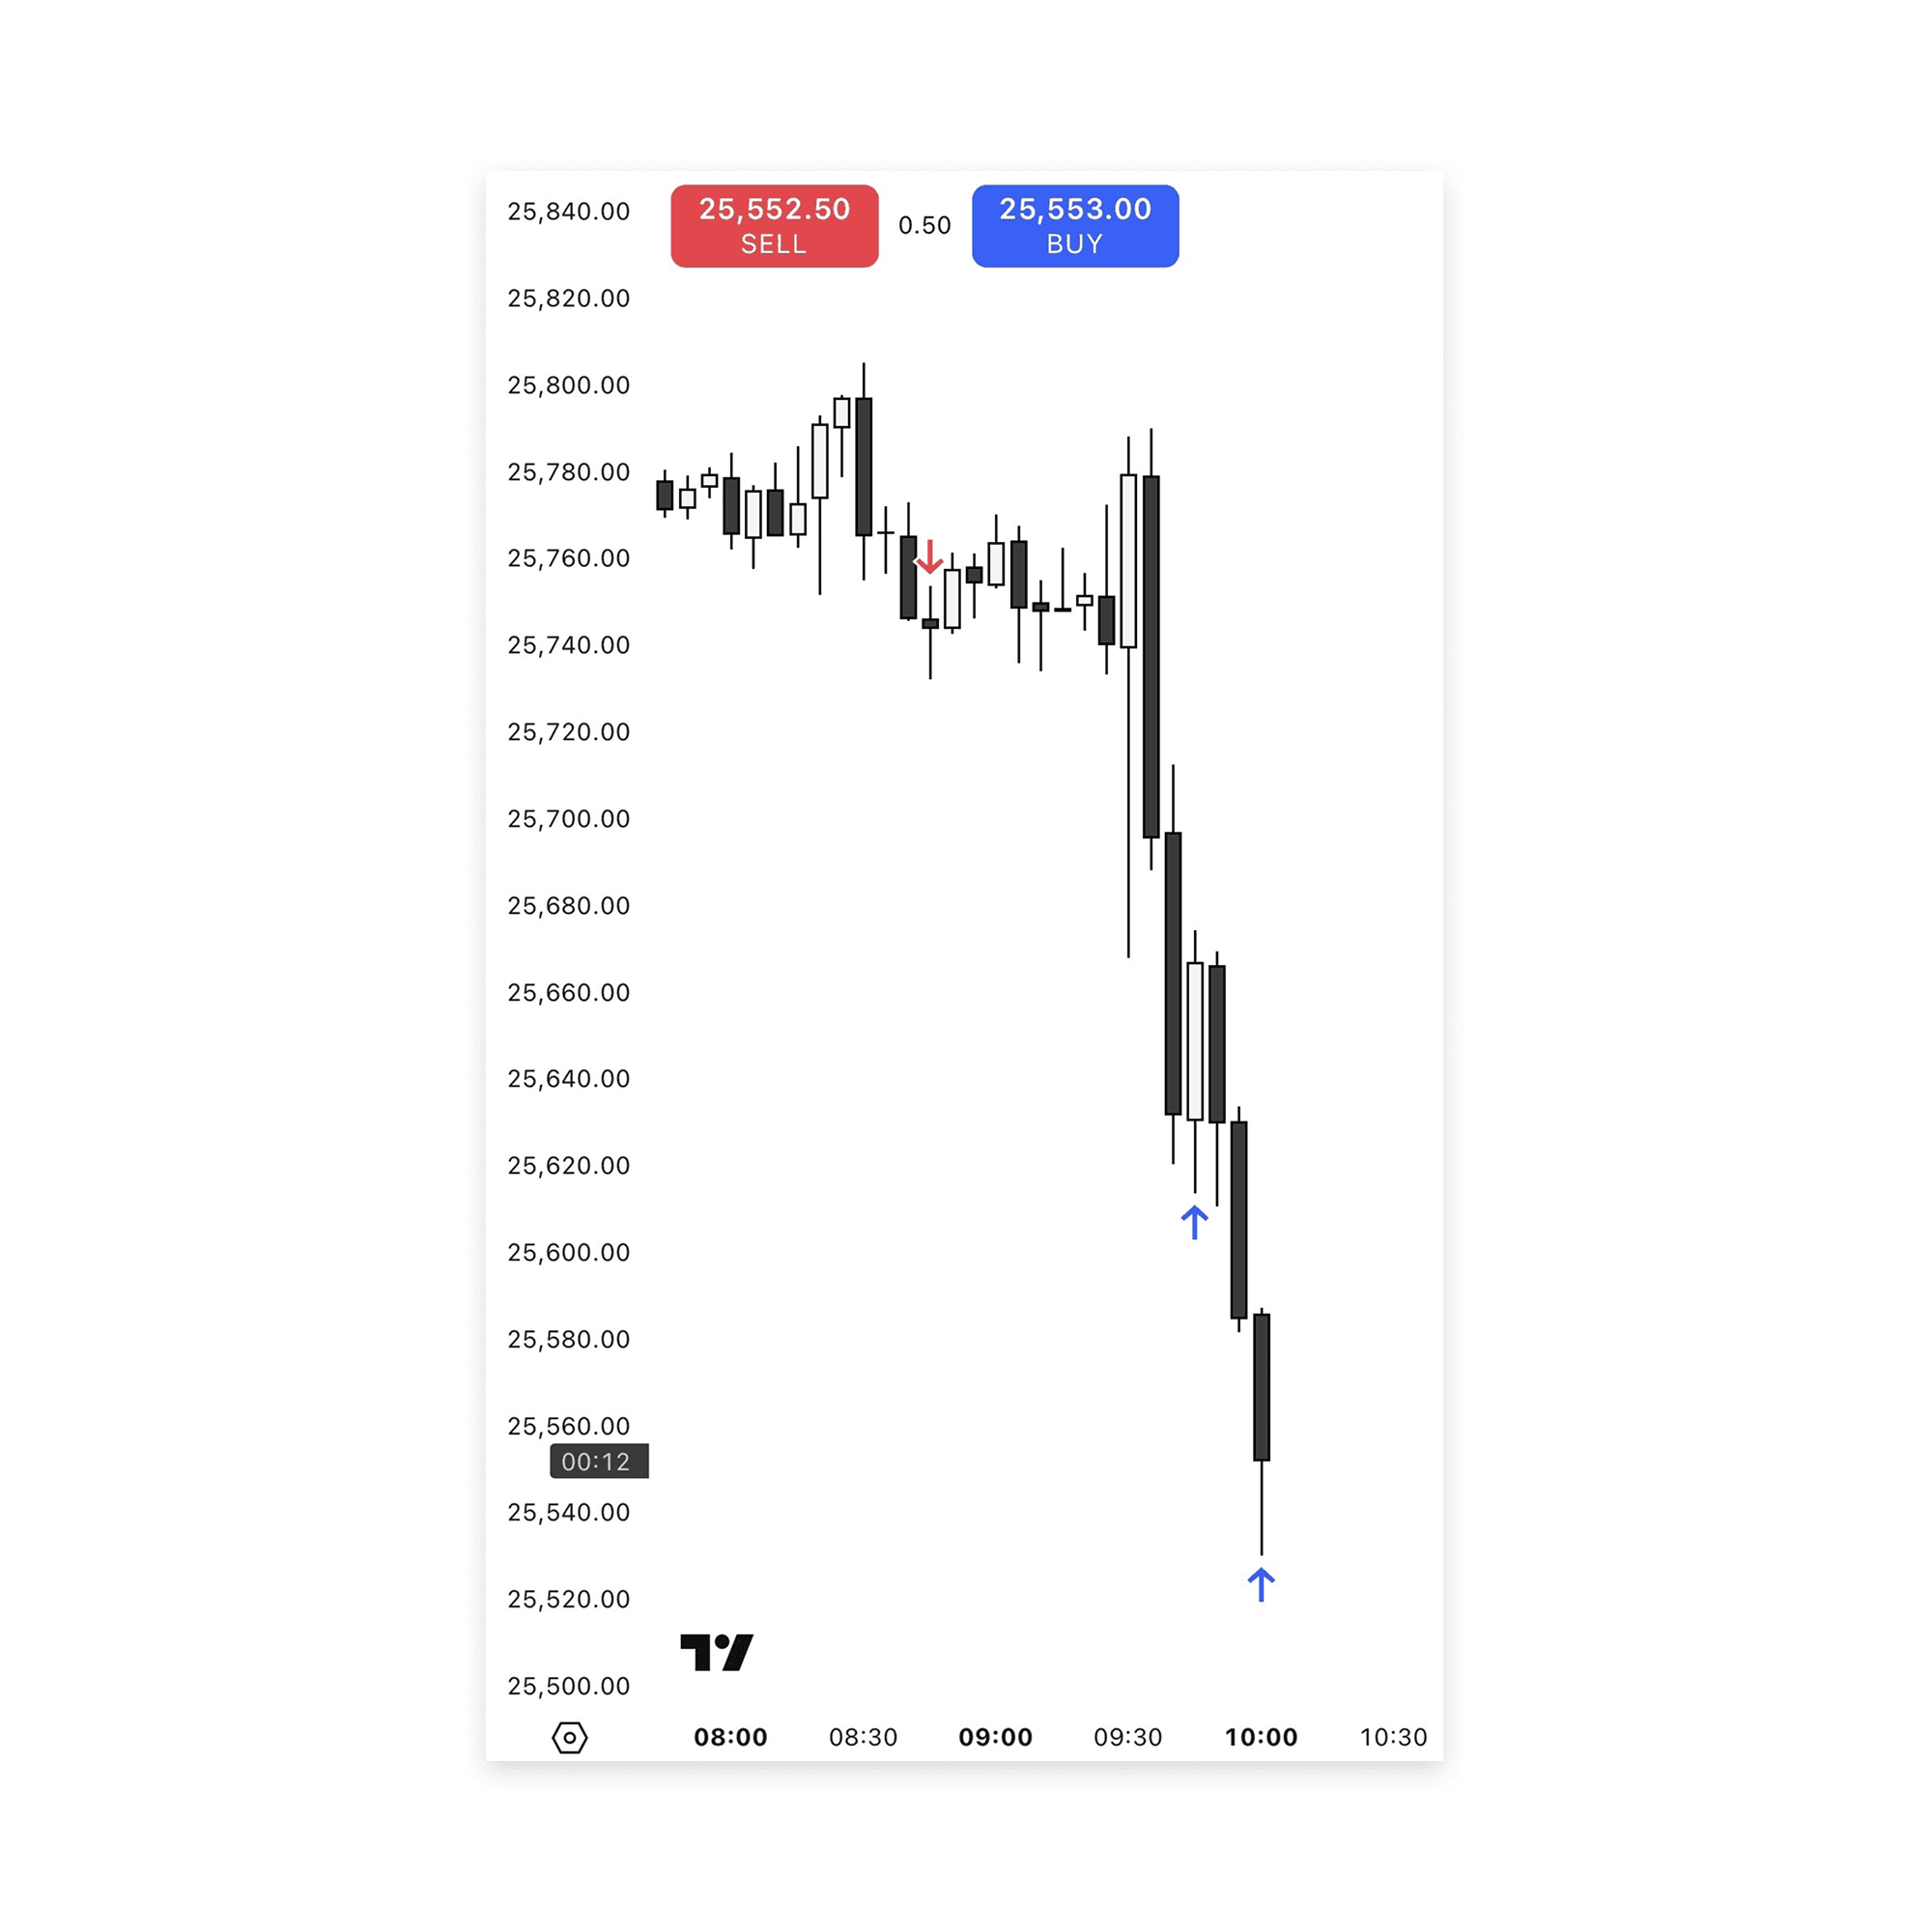
The economic calendar displaying low impact news at 08:30 shows that there will be a volatility driver prior to the New York session open. This brings a time of interest to seek potential entries. Volatility drivers not only provide confluence to entry signatures, but can also be the trigger for the start of an intraday expansion.
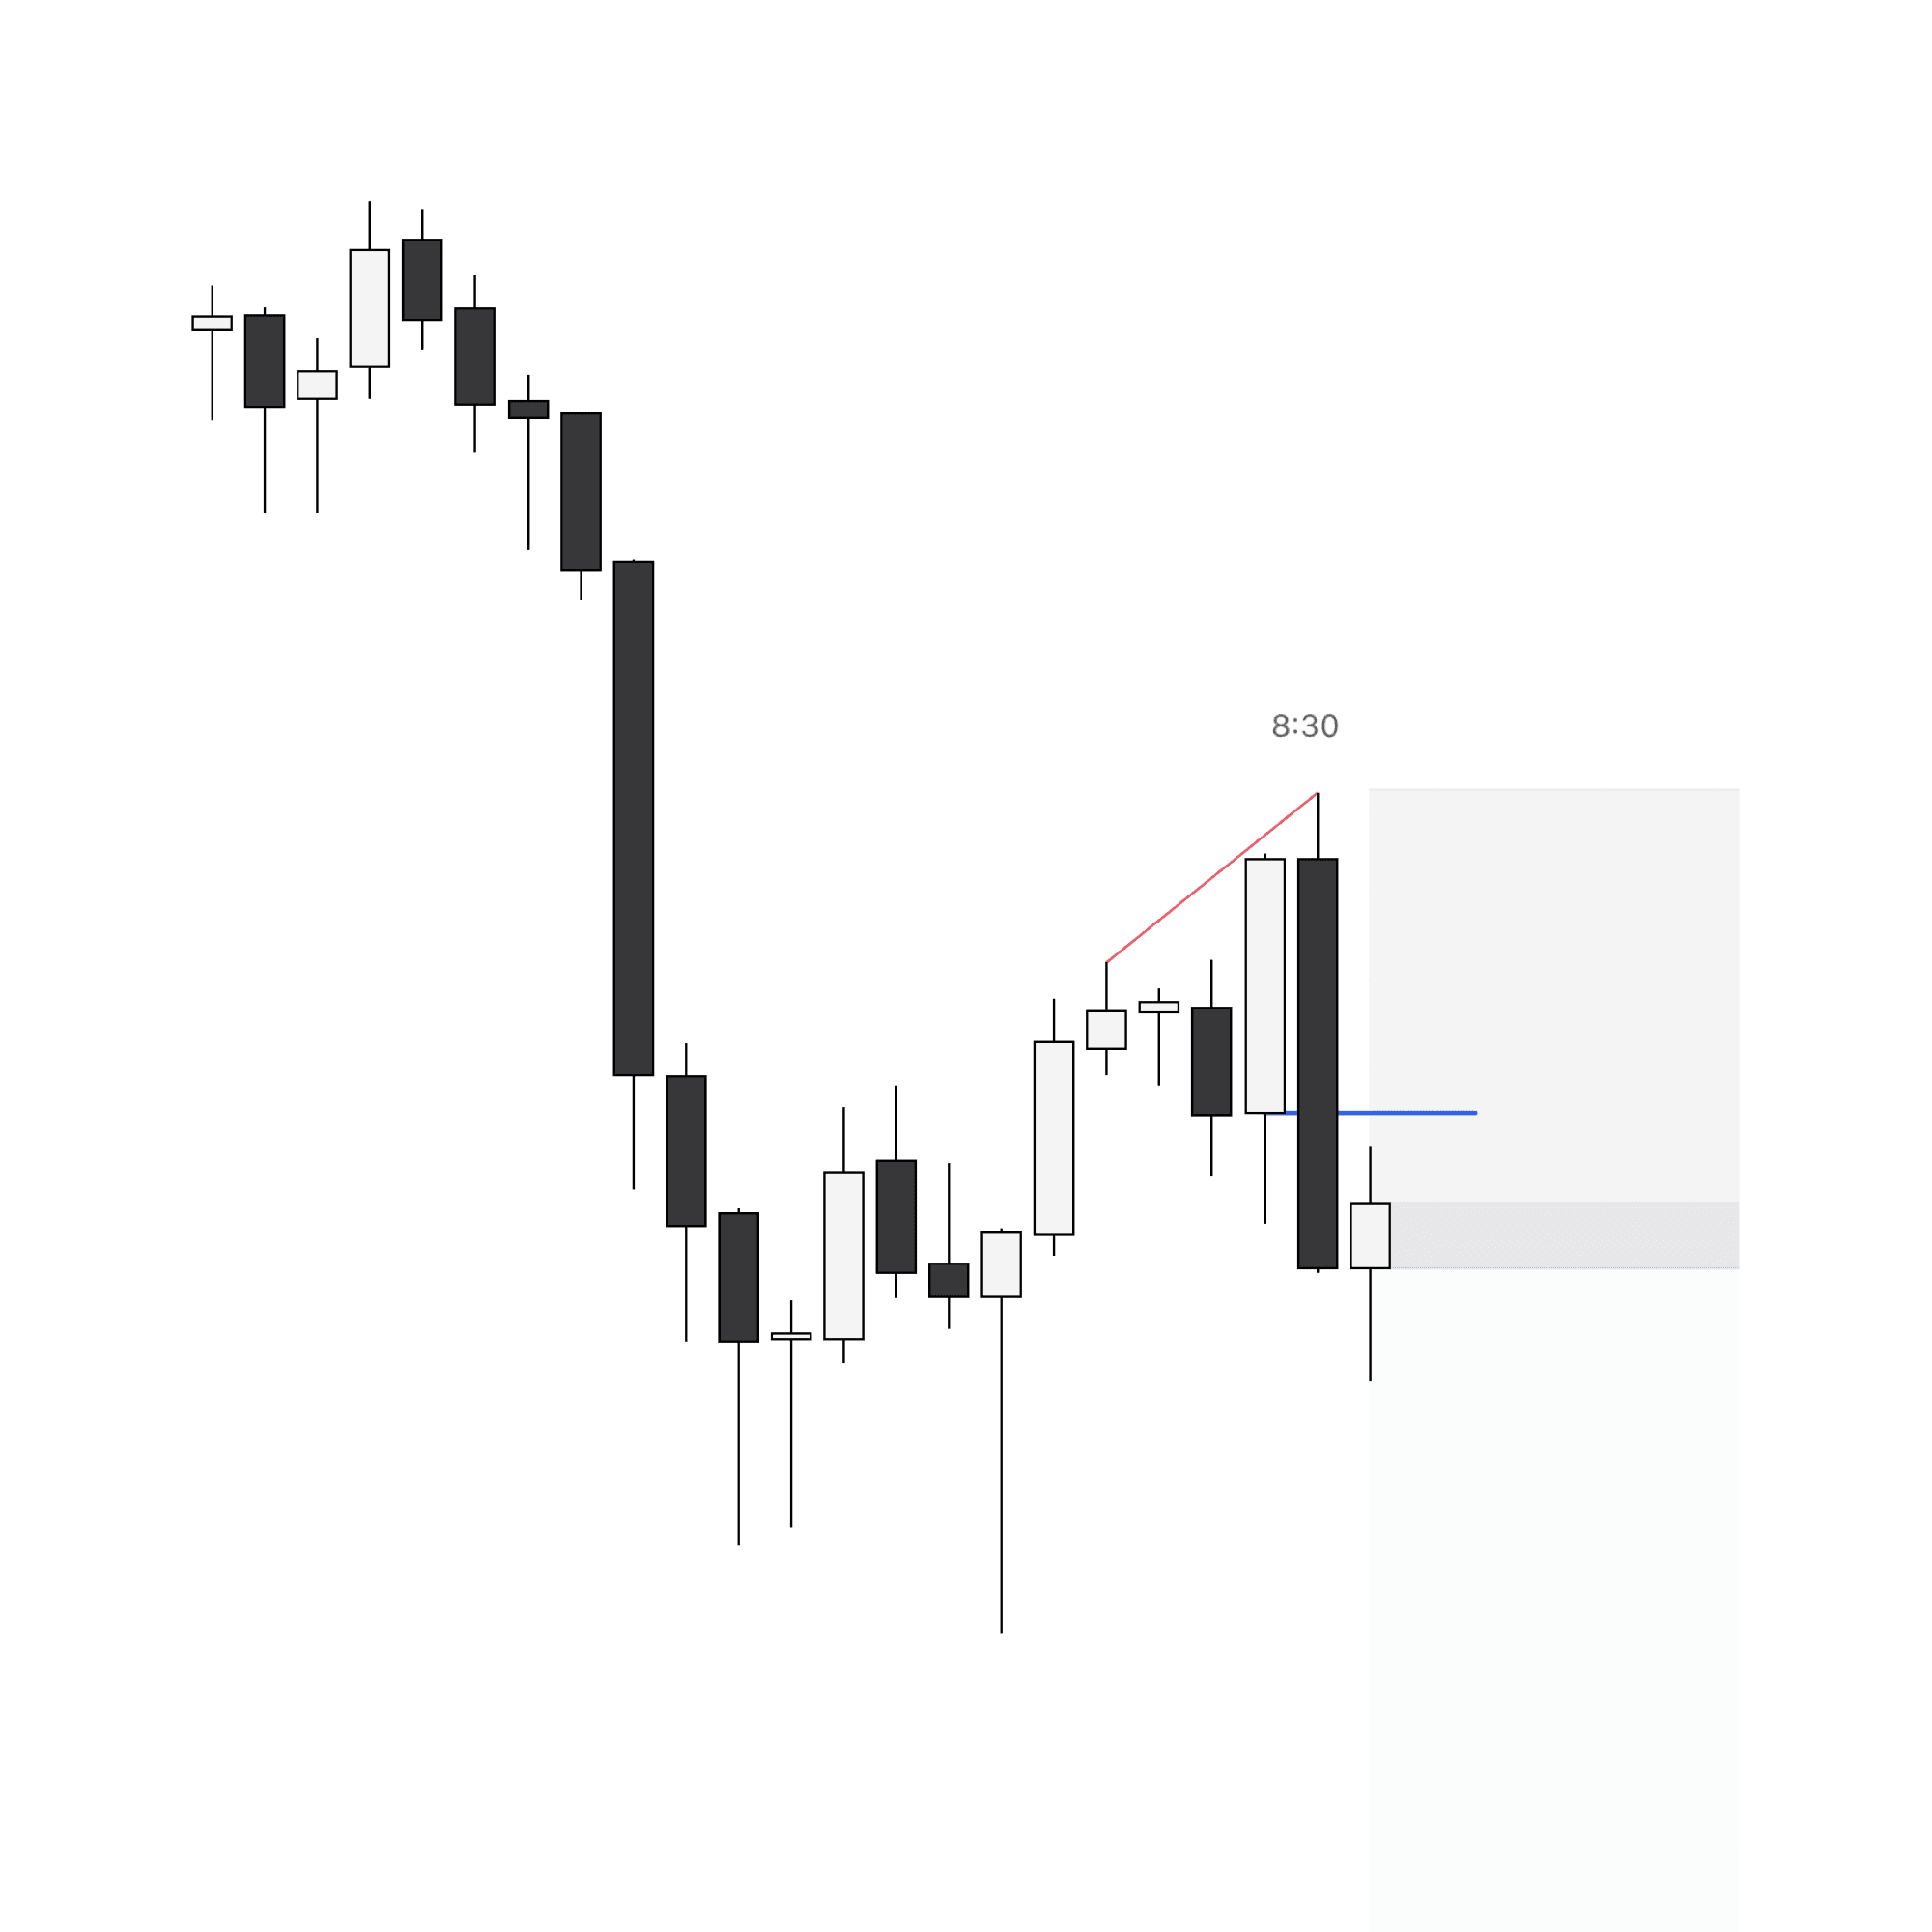
This example shows how volatility from the news event pairs with an entry signature. The driver immediately expands price lower to support the move and provides a 15-minute closure below the upclose candle alongside a divergence with ES. This is a prime area to take a short position with the understanding of the context inside this day and where price currently stands.
Opposing Target and Trade Management
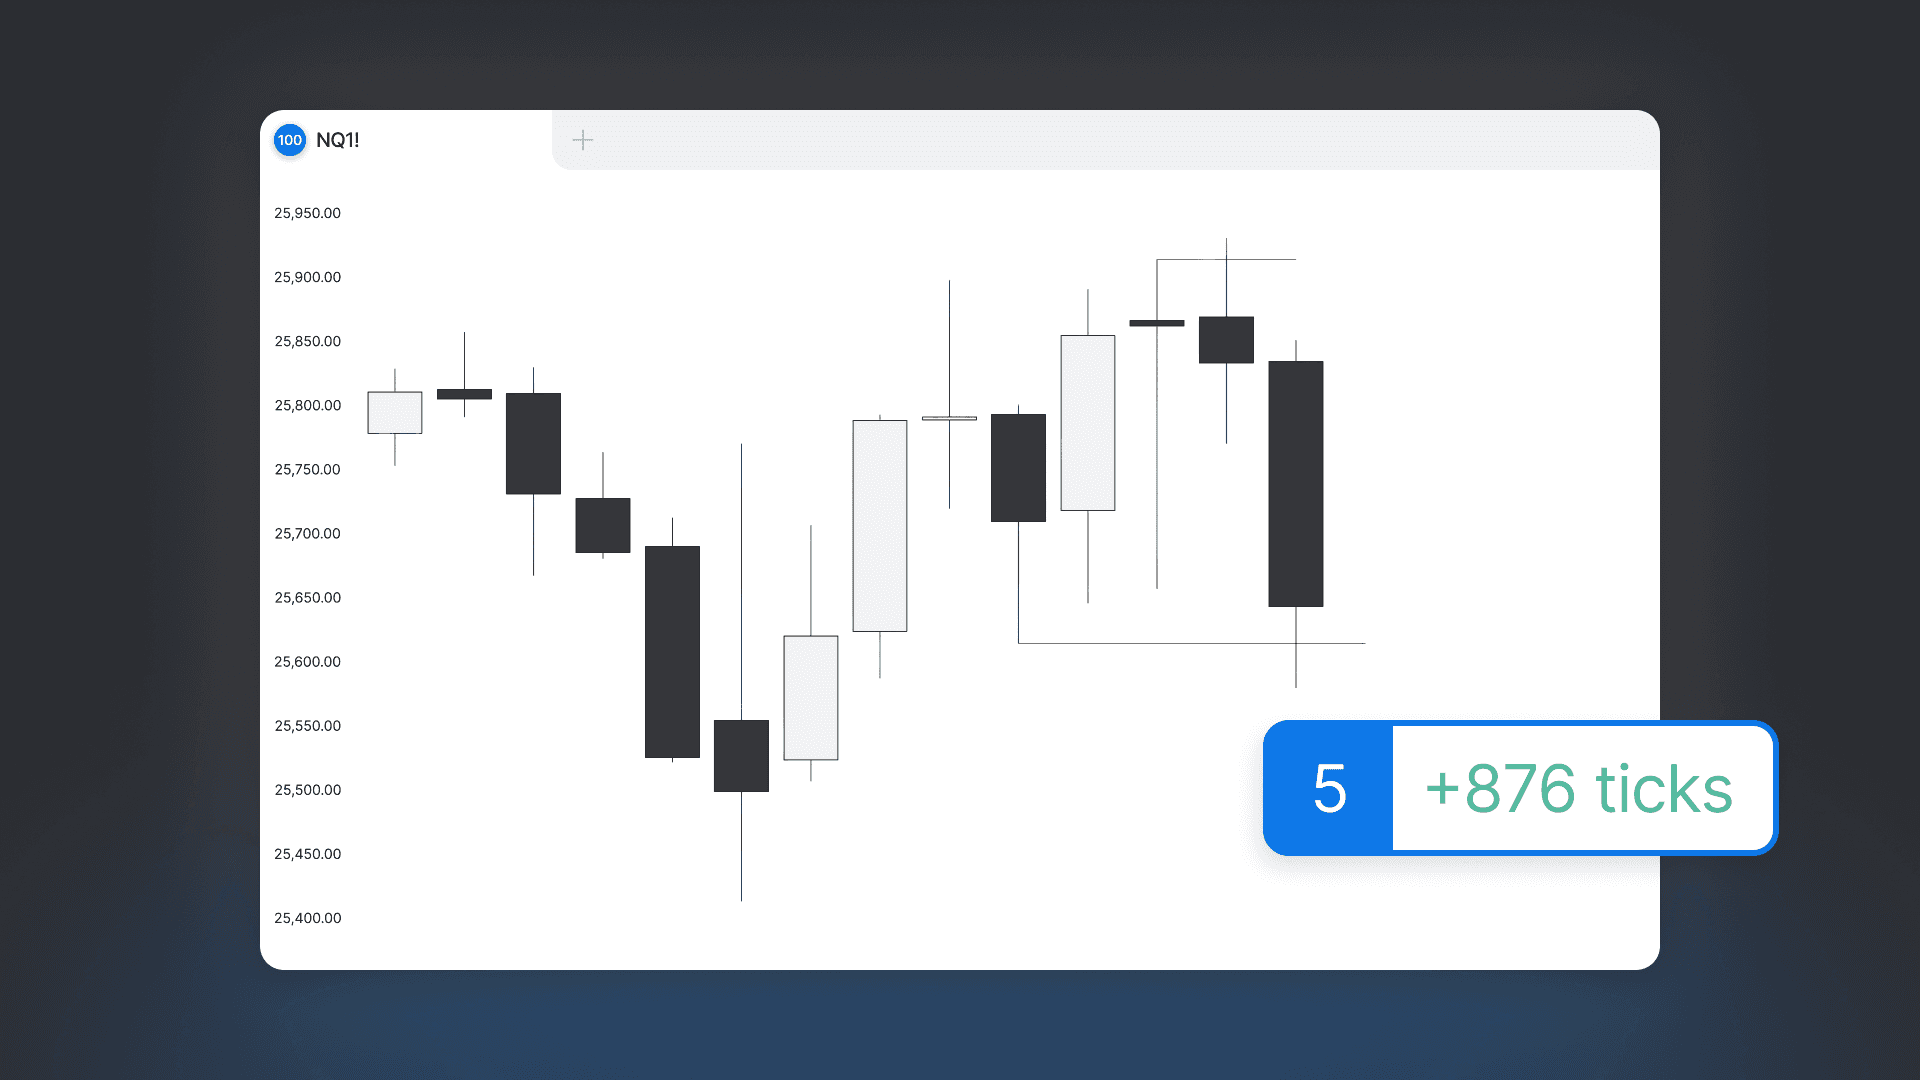
Everything that is done inside the system is rooted in the higher timeframe. It is simply understanding if and where the daily candle is expanding to position alongside it when offered. The chart below shows the complete move from manipulation of the range high to the expansion down into the failure swings at the range low. You avoid the indecisive days and trade the obvious ones through the range protocol.
It is always expected that the New York session will bring volatility into the market. It does not mean that you should actively move your stop loss while the trade is still in the process of playing out. Once price breaks down and achieves proper risk to reward, scaling takes place. The final contracts on the position are closed out the moment price reaches the opposing side of the range, as there is no further expansion expectation at that point. The move is complete and over for the day.
Prop
Learn
Explore mentorship with

AM and

TTrades
The standard of trading guidance

Prop
Learn
Get funded with the prop
firms I trade with
Use code AM for the best discount


Watch video
Understanding the Range Protocol
To understand ranges, you must first understand failure swings and relevant swings on the daily timeframe. Failure swings are unestablished reversals in the market that we do not trade away from. Once failure swings form on both sides of the market on the daily chart, that is the moment price is considered in a range. This is a neutral condition in the market as long as price remains internal to the relevant high and low that it sits between.
The one fact of ranged markets is that they are only as difficult to trade as you make them for yourself. Avoiding speculation or execution while price remains internal with failure swings on both sides of the market is the one rule to follow. This will keep you from trading within the consolidation and getting caught in low quality conditions where losses build up. Waiting for price to engage the external range where the relevant swings exist is where our focus goes.
Identifying Framework at the External Range
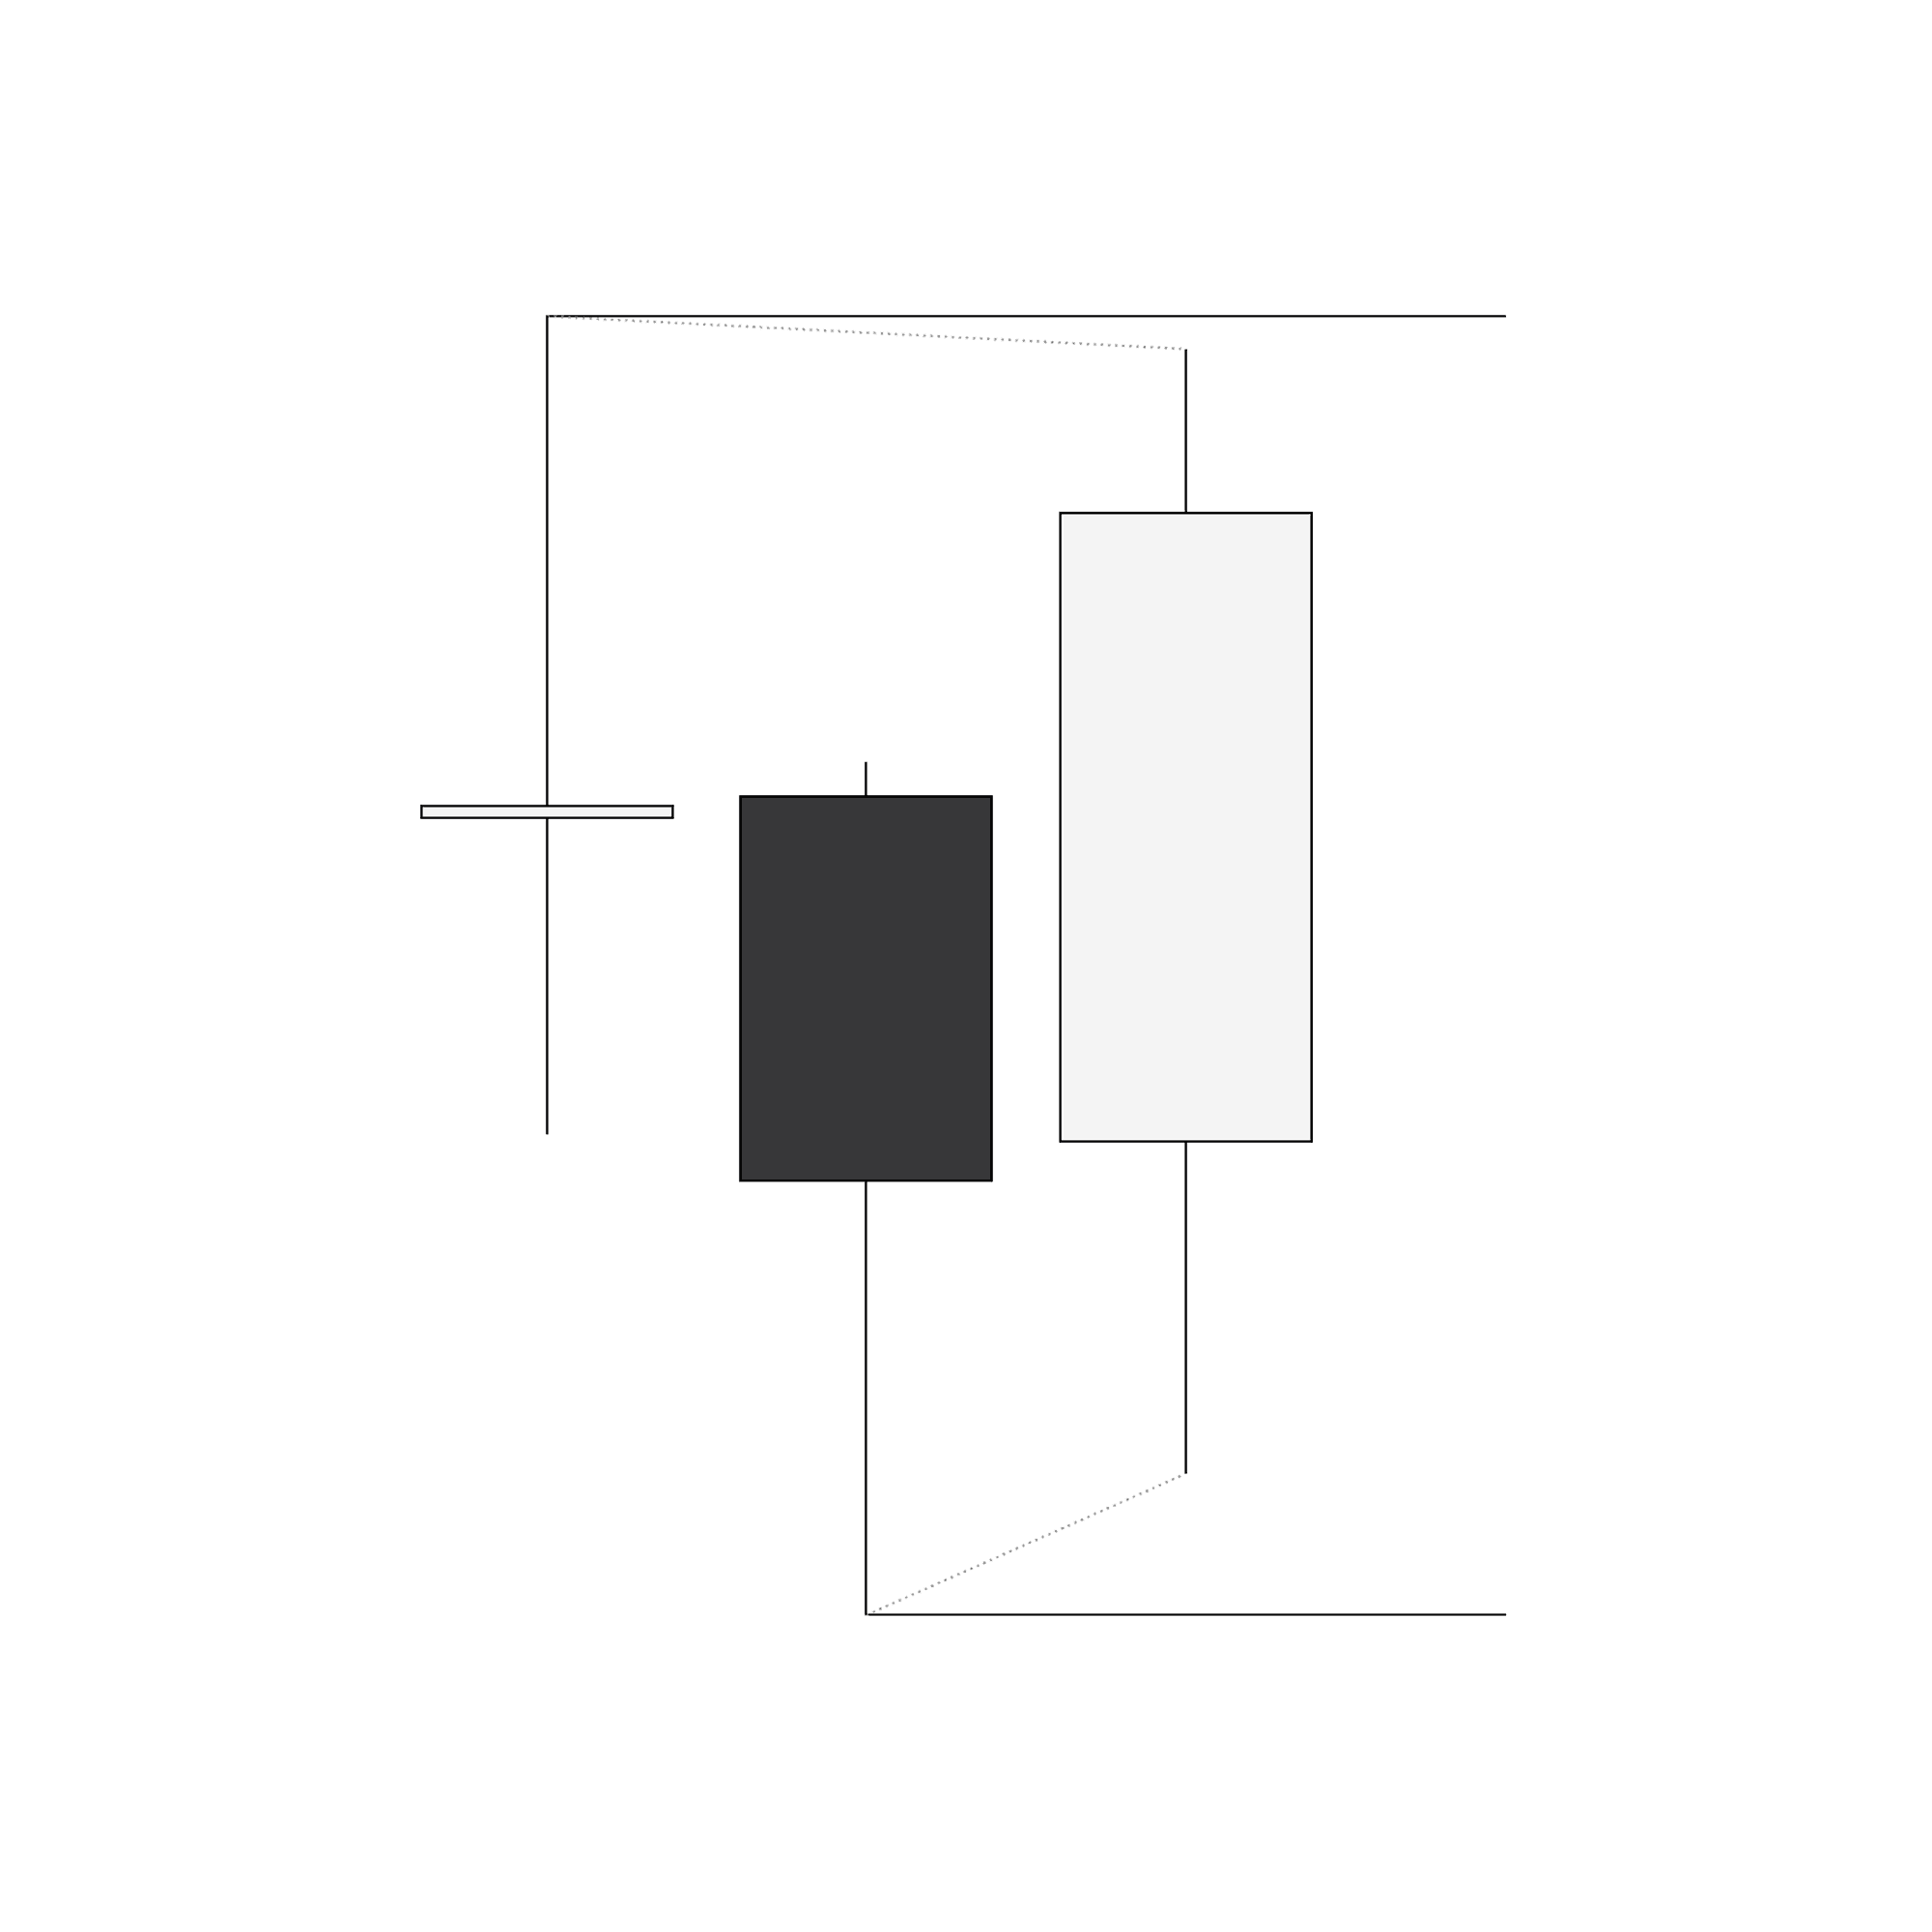
Once price engages the external range, the development and reaction at that point tell us where the market should go next. The development in this case shows an initial failed manipulation and then a valid manipulation on the following day. If the market manipulates a relevant swing on the previous day, then the current day should be an expansion away from the reversal if the daily profile aligns.
The invalidation point is set at the equilibrium of the opposing wick. This is an area in the market that price should remain in respect to, as it demands that the next day forms a small upper wick which supports expansion to the downside.
Confirmation Within the Daily Profile
The confirmation step is where ideas can become actionable. It allows us to take in all the information the market is proving to us to determine if the daily candle is developing in a way which will deliver the framework from the daily.
Viewing the structure of Asia and London on the morning of this trade, it shows that price has already established a high of day in respect to the invalidation point. The failure swings below on the other side of the range also remain open as a target in price. You can see the idea from the analysis post inside The Market Lens leading into the execution.
It is clear at this time that everything is presented to seek a quality trade.
Framework from the daily with a previous day manipulation
High of day established in respect to the invalidation point
Failure swings remain open below providing an objective
When these factors are presented under the system, it is assumed the daily candle is in continuation with room to expand through the New York session. This is the ideal condition to position within once all steps are aligned. The only focus at this point is a valid entry signature to get onside and capitalize.
Entry Signature in the Continuation
With the focus on the continuation, timing the entry on a valid signature is the final piece. We hold high conviction that the daily candle will expand lower. All that needs to be done is positioning in the market without being stopped out.
The economic calendar displaying low impact news at 08:30 shows that there will be a volatility driver prior to the New York session open. This brings a time of interest to seek potential entries. Volatility drivers not only provide confluence to entry signatures, but can also be the trigger for the start of an intraday expansion.
This example shows how volatility from the news event pairs with an entry signature. The driver immediately expands price lower to support the move and provides a 15-minute closure below the upclose candle alongside a divergence with ES. This is a prime area to take a short position with the understanding of the context inside this day and where price currently stands.
Opposing Target and Trade Management
Everything that is done inside the system is rooted in the higher timeframe. It is simply understanding if and where the daily candle is expanding to position alongside it when offered. The chart below shows the complete move from manipulation of the range high to the expansion down into the failure swings at the range low. You avoid the indecisive days and trade the obvious ones through the range protocol.
It is always expected that the New York session will bring volatility into the market. It does not mean that you should actively move your stop loss while the trade is still in the process of playing out. Once price breaks down and achieves proper risk to reward, scaling takes place. The final contracts on the position are closed out the moment price reaches the opposing side of the range, as there is no further expansion expectation at that point. The move is complete and over for the day.
Understanding the Range Protocol
To understand ranges, you must first understand failure swings and relevant swings on the daily timeframe. Failure swings are unestablished reversals in the market that we do not trade away from. Once failure swings form on both sides of the market on the daily chart, that is the moment price is considered in a range. This is a neutral condition in the market as long as price remains internal to the relevant high and low that it sits between.
The one fact of ranged markets is that they are only as difficult to trade as you make them for yourself. Avoiding speculation or execution while price remains internal with failure swings on both sides of the market is the one rule to follow. This will keep you from trading within the consolidation and getting caught in low quality conditions where losses build up. Waiting for price to engage the external range where the relevant swings exist is where our focus goes.
Identifying Framework at the External Range
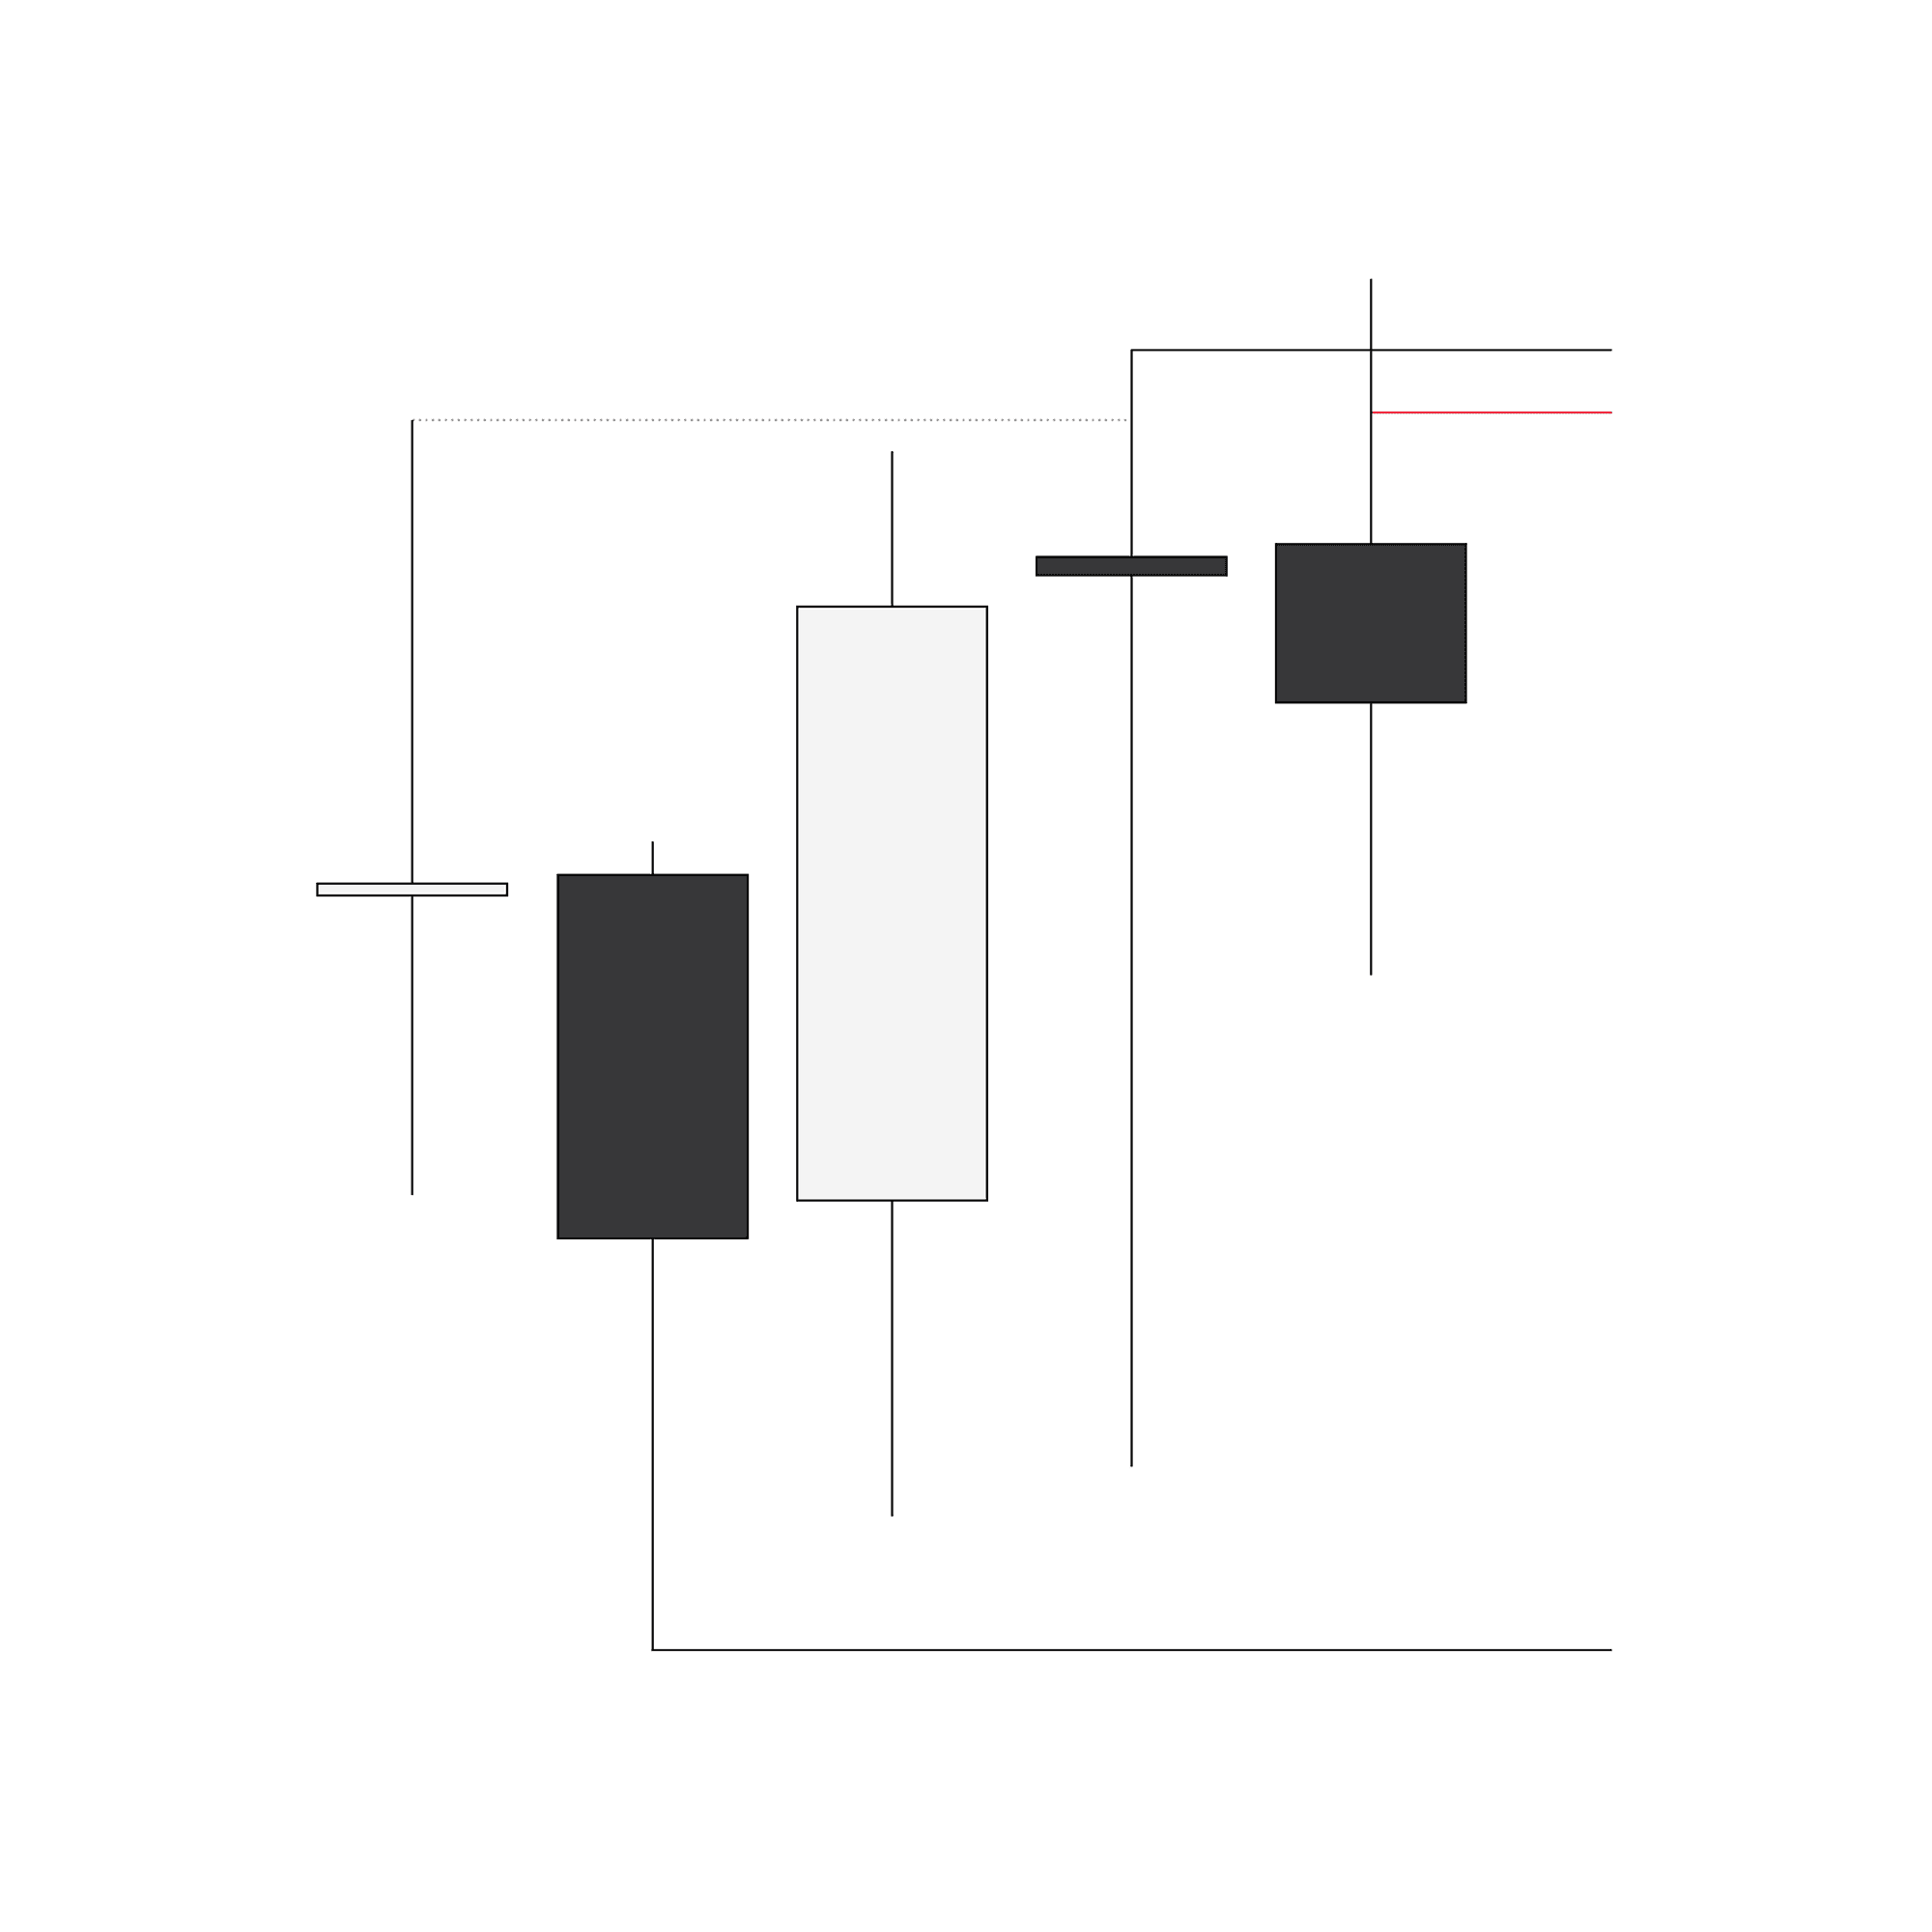
Once price engages the external range, the development and reaction at that point tell us where the market should go next. The development in this case shows an initial failed manipulation and then a valid manipulation on the following day. If the market manipulates a relevant swing on the previous day, then the current day should be an expansion away from the reversal if the daily profile aligns.
The invalidation point is set at the equilibrium of the opposing wick. This is an area in the market that price should remain in respect to, as it demands that the next day forms a small upper wick which supports expansion to the downside.
Confirmation Within the Daily Profile
The confirmation step is where ideas can become actionable. It allows us to take in all the information the market is proving to us to determine if the daily candle is developing in a way which will deliver the framework from the daily.
Viewing the structure of Asia and London on the morning of this trade, it shows that price has already established a high of day in respect to the invalidation point. The failure swings below on the other side of the range also remain open as a target in price. You can see the idea from the analysis post inside The Market Lens leading into the execution.
It is clear at this time that everything is presented to seek a quality trade.
Framework from the daily with a previous day manipulation
High of day established in respect to the invalidation point
Failure swings remain open below providing an objective
When these factors are presented under the system, it is assumed the daily candle is in continuation with room to expand through the New York session. This is the ideal condition to position within once all steps are aligned. The only focus at this point is a valid entry signature to get onside and capitalize.
Entry Signature in the Continuation
With the focus on the continuation, timing the entry on a valid signature is the final piece. We hold high conviction that the daily candle will expand lower. All that needs to be done is positioning in the market without being stopped out.
The economic calendar displaying low impact news at 08:30 shows that there will be a volatility driver prior to the New York session open. This brings a time of interest to seek potential entries. Volatility drivers not only provide confluence to entry signatures, but can also be the trigger for the start of an intraday expansion.
This example shows how volatility from the news event pairs with an entry signature. The driver immediately expands price lower to support the move and provides a 15-minute closure below the upclose candle alongside a divergence with ES. This is a prime area to take a short position with the understanding of the context inside this day and where price currently stands.
Opposing Target and Trade Management
Everything that is done inside the system is rooted in the higher timeframe. It is simply understanding if and where the daily candle is expanding to position alongside it when offered. The chart below shows the complete move from manipulation of the range high to the expansion down into the failure swings at the range low. You avoid the indecisive days and trade the obvious ones through the range protocol.
It is always expected that the New York session will bring volatility into the market. It does not mean that you should actively move your stop loss while the trade is still in the process of playing out. Once price breaks down and achieves proper risk to reward, scaling takes place. The final contracts on the position are closed out the moment price reaches the opposing side of the range, as there is no further expansion expectation at that point. The move is complete and over for the day.
Prop
Learn
Get funded with the prop firms I trade with
Use code AM for the best discount


Prop
Learn
Explore mentorship with
AM and
TTrades

Prop
Learn
Get funded with the prop firms I trade with
Use code AM for the best discount
Prop
Learn
Explore mentorship with
AM and
TTrades
Prop
Learn
Explore mentorship with
AM and
TTrades
The standard of trading guidance
Prop
Learn
Get funded with the prop
firms I trade with
Use code AM for the best discount
Prop
Learn
Explore mentorship with
AM and
TTrades
The standard of trading guidance
Prop
Learn
Get funded with the prop
firms I trade with
Use code AM for the best discount

Using Range Protocol to Capture Expansion
Continue Learning.


© 2026 AM Trades. All Rights Reserved.
© 2026 AM Trades. All Rights Reserved.


© 2026 AM Trades. All Rights Reserved.